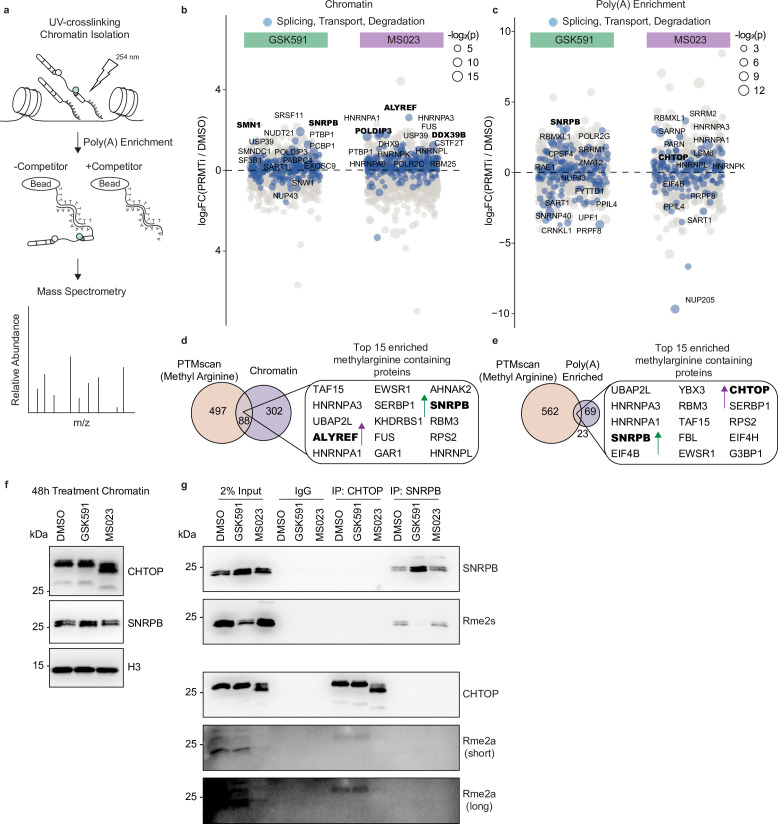
Figure 4. PRMT inhibition promotes aberrant binding of RNA processing factors to chromatin-associated poly(A) RNA.
(a) Overview of chromatin-associated poly(A)-RNA LC-MS/MS experiment. (b, c) Dot plot of proteins bound to chromatin (b) or chromatin-associated poly(A) RNA (c) relative to DMSO. Circle size is proportional to −log2(p). Colored values denote factors with ontology pertaining to RNA splicing, transport, or degradation. The names of the top 15 significant proteins are labeled. Significance determined using a heteroscedastic t-test. (d, e) Venn diagram comparing proteins containing methylarginine (Maron et al., 2021) and those that were differentially enriched in the chromatin (d) or chromatin-associated poly(A) (e) fractions following PRMT inhibition. (f) Western blot of chromatin following 2-day treatment with DMSO, GSK591, or MS023. See Figure 4—source data 1. (g) Immunoprecipitation and analysis of CHTOP and SNRPB methylarginine following treatment with DMSO, GSK591, or MS023 for 2 days. See Figure 4—source data 2.


