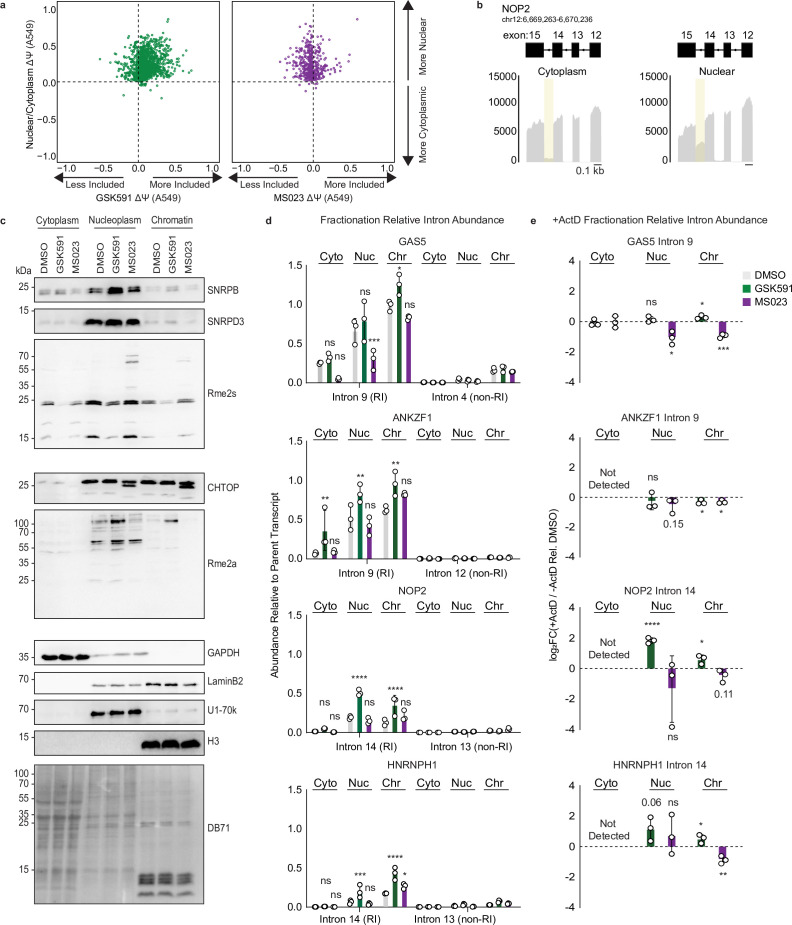
Figure 6. PRMT-dependent RI are localized to the nucleoplasm and chromatin.
(a) Scatter plot of ΔΨ for common RI in A549 nuclear/cytoplasmic fractions and GSK591 (left, green) or MS023 (right, purple) treated cells where ΔΨ=Ψ (Nuclear/PRMT inhibition)–Ψ (Cytoplasm/DMSO). (b) Genome browser track of poly(A)-RNA seq aligned reads for NOP2 in A549 cytoplasmic or nuclear fractions. (c) Western blot of cellular fractions following 2-day treatment with DMSO, GSK591, or MS023. DB71=Direct Blue 71 membrane stain. See Figure 6—source data 1. (d) RT-qPCR of RI or non-RI from cytoplasmic, nuclear, or chromatin fractions of A549 cells treated with DMSO, GSK591, or MS023 for 2 days. Data are represented as mean ± SD. Significance determined using two-way analysis of variance with Tukey’s multiple comparisons test; *<0.05, **<0.01, ***<0.001, ****<0.0001, ns=not significant. (e) RT-qPCR of RI (−) and (+) ActD relative to DMSO from cytoplasmic, nuclear, or chromatin fractions. Data are represented as mean ± SD. Significance determined using Student’s t-test; *<0.05, **<0.01, ***<0.001, ****<0.0001, ns=not significant.

