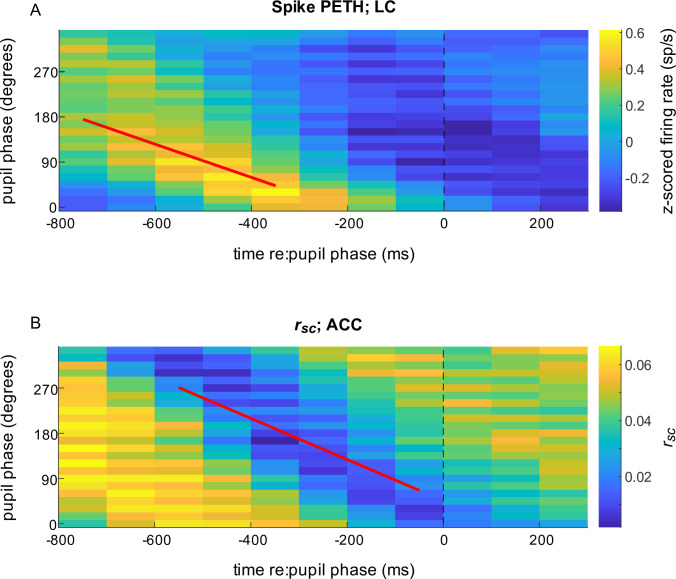
Figure 5. Spiking responses of locus coeruleus (LC) neurons and correlated activity in anterior cingulate cortex (ACC) relative to pupil phase.
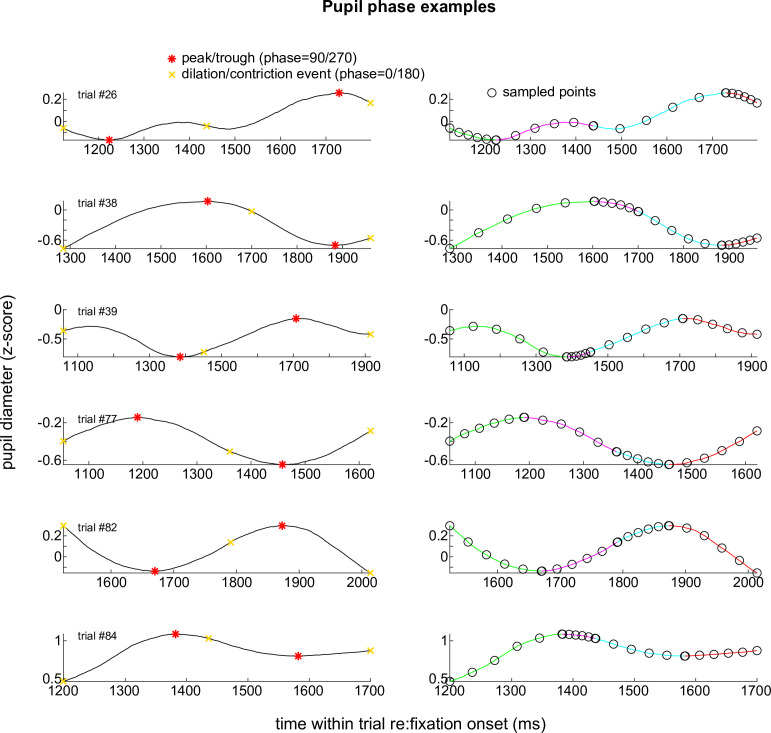
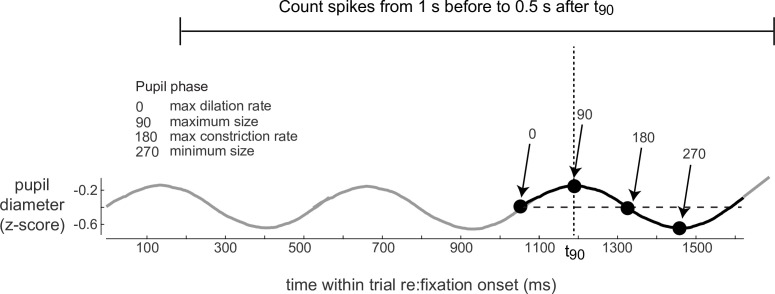
(A) Mean LC spike rate (colormap, in sp/s z-scored per unit) computed in 500 ms-wide bins aligned to the time of occurrence of each pupil phase. For each complete pupil cycle, phase is defined with respect to the maximum rate of dilation (0°), the maximum size (90°), the maximum rate of constriction (180°), and the minimum size (270°; see Figure 6—figure supplement 1). Thus, the color shown at time = t (abscissa), phase = p (ordinate) corresponds to the mean spiking rate from all LC neurons that occurred in a 500 ms-wide bin centered at t ms relative to the time of pupil phase p. Diagonal structure with a slope of ~–0.3 deg/ms implies a consistent relationship between LC firing and pupil phase for the given range of temporal offsets and pupil fluctuations, or hippus, that have a period of ~600 ms (Joshi et al., 2016). (B) ACC rsc aligned to pupil phase, computed as in (A). In both panels, data are combined from all sessions for visualization. Lines are plotted using the median regression coefficients from statistically reliable linear fits (H0: slope = 0, p < 0.05) to the maxima of phase-aligned LC spiking computed per unit (A; median [IQR] slope = −0.33 [–0.48–0.22] deg/ms) and minima of the phase-aligned ACC rsc computed per ACC pair (B; slope = −0.41 [–0.54–0.25] deg/ms).


