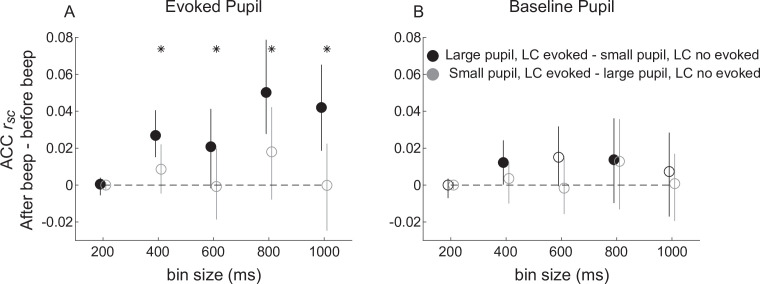
Figure 8. Beep-related differences in anterior cingulate cortex (ACC) correlations relative to locus coeruleus (LC) responses and pupil size.
(A) Difference in ACC rsc computed after versus before the beep plotted as a function of bin size for trials groups based on evoked LC spiking and evoked pupil dilations (groups as indicated in the legend in B). (B) Difference in ACC rsc computed after versus before the beep plotted as a function of bin size for trials groups based on evoked LC and baseline pupil size. Circles and vertical lines are median and bootstrapped 95% confidence estimates across the given set of ACC pairs. In both panels, asterisks indicate Mann–Whitney U-test for H0: median difference in ACC rsc (after relative to before the beep) is different for trials with (LC-evoked) versus without (LC not evoked) a transient LC response for the given bin size, p < 0.05 for both monkeys’ data pooled together; filled circles indicate sign-rank test for H0: ACC rsc differences (after relative to before the beep) within each group is different from zero, p < 0.05 for both monkeys’ data pooled together. An ANOVA with groups (black and gray symbols as indicated in B), bin size, and pupil measure (baseline or evoked) as factors showed reliable effects of group and the interaction between group and pupil measure.


