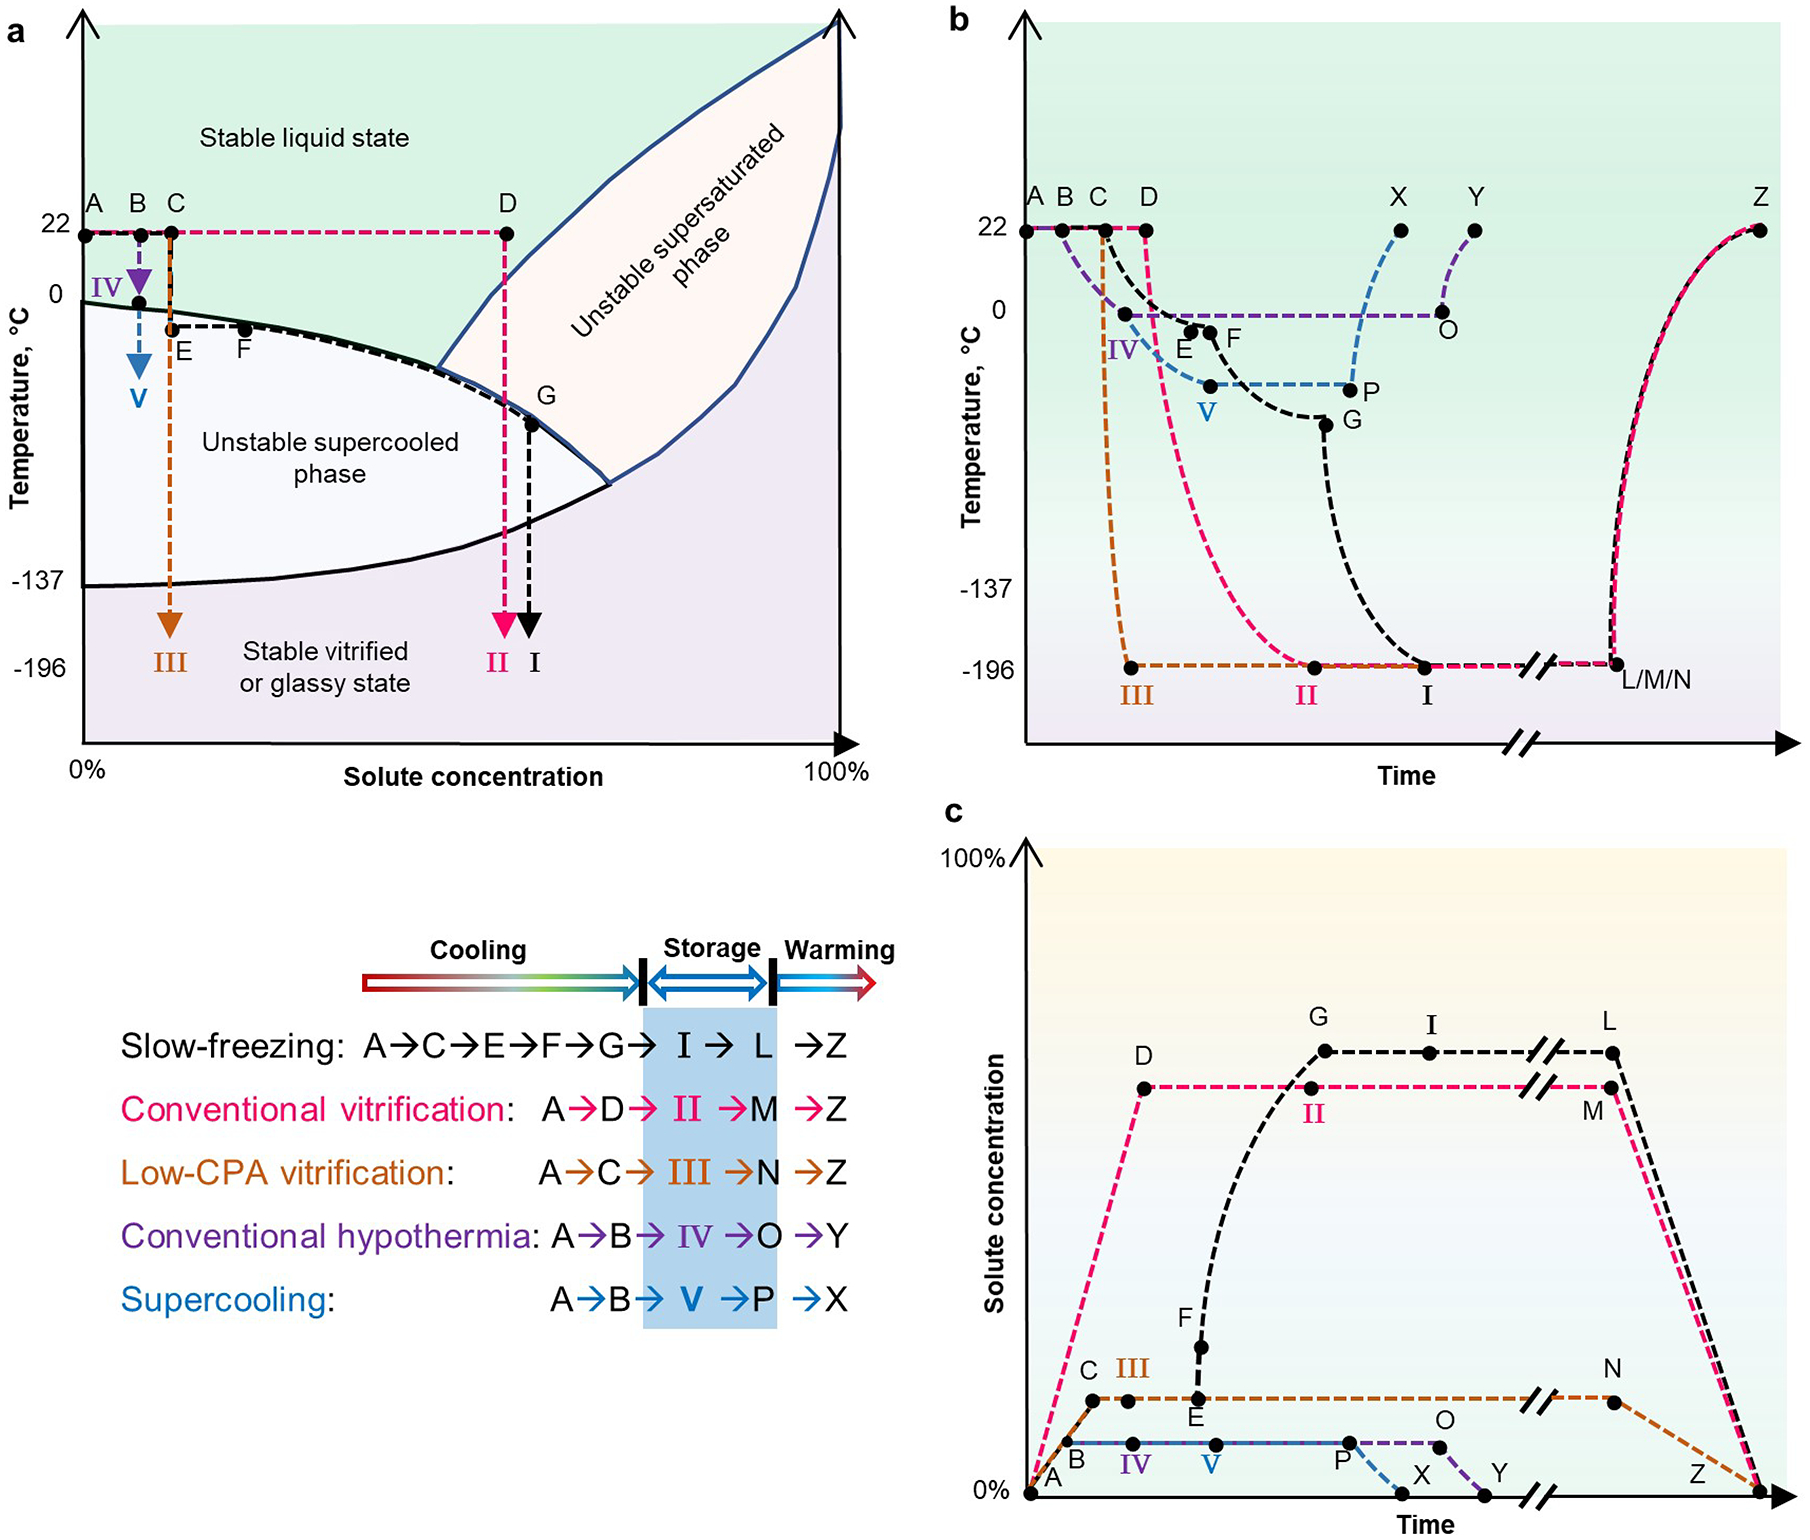
Fig. 2 |. Phase diagrams, and thermal and osmotic time courses, for five main biospecimen-preservation methods.

For each preservation method — I, slow freezing; II, conventional vitrification; III, low-CPA vitrification; IV, conventional hypothermia; and V, supercooling — the thermodynamic paths involved in the cooling, storage and warming steps are indicated. a, Diagram of the phases of matter of biospecimens processed with different preservation methods. Arrows indicate the direction of the preservation process. b, Thermal time course. c, Time course of the solute concentration (or osmolality). Axes not drawn to scale. The rates of temperature change and of osmolality change are indicated by the slopes of the curves. Long-term storage is indicated by ‘//’. For simplicity, panel a doesn’t show the steps of storage and warming, and panels a and b do not show temperature fluctuations arising from the release (during cooling) and absorption (during heating) of latent heat associated with phase changes. It is assumed that there is no solute precipitation during freeze concentration (path E→F→G) and during plunging into liquid nitrogen (path G→I). Temperature profiles during cooling are approximated as convex curves (in paths C→I, D→II, C→III, B→IV, and B→V) because cooling rates decrease as the temperature of the biospecimen drops, and as concave curves (in paths L/M/N→Z, O→Y, and P→X) during warming because the warming rate decreases as the biospecimen temperature increases179. The solute-concentration paths in c are drawn as straight lines because CPA loading and unloading can be controlled arbitrarily before and after preservation.
