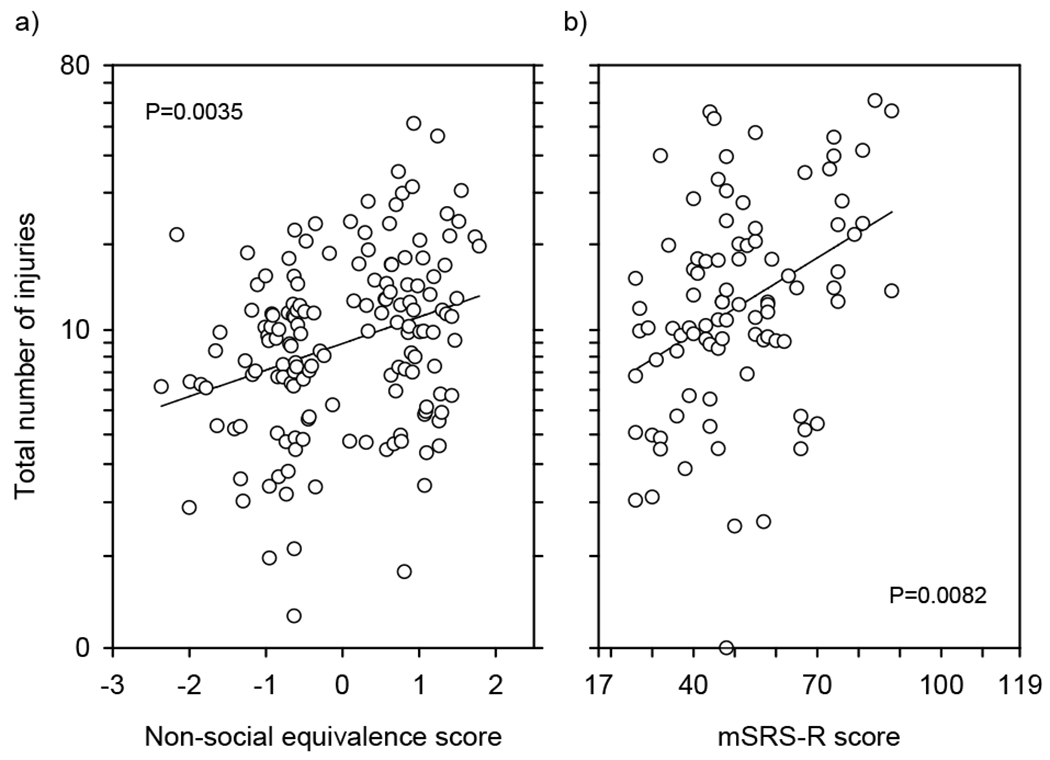
FIGURE 4.

Relationships between sociality measures and total number of traumatic injuries received. (a) Nonsocial equivalence score significantly and positively predicts total number of traumatic injuries received (N = 152). (b) mSRS-R score significantly and positively predicts total number of traumatic injuries received (N = 91). Data are plotted corrected (partialled) for other terms in the model. Thus, we figured the least squares line for each data point and then plotted the data point as the residual from this expected value. This is directly equivalent to the calculations for plotting an LSM ± SE. These values were then scaled to the same range as the original data. Given the log–log model, this means that each data point is corrected from the observed age to the mean log age of the animals in the data set. This is 66 months of age for (a) and 67 months of age for (b). The data are plotted on a log scale to reflect the linearity and homogeneity of variance of the underlying analysis
