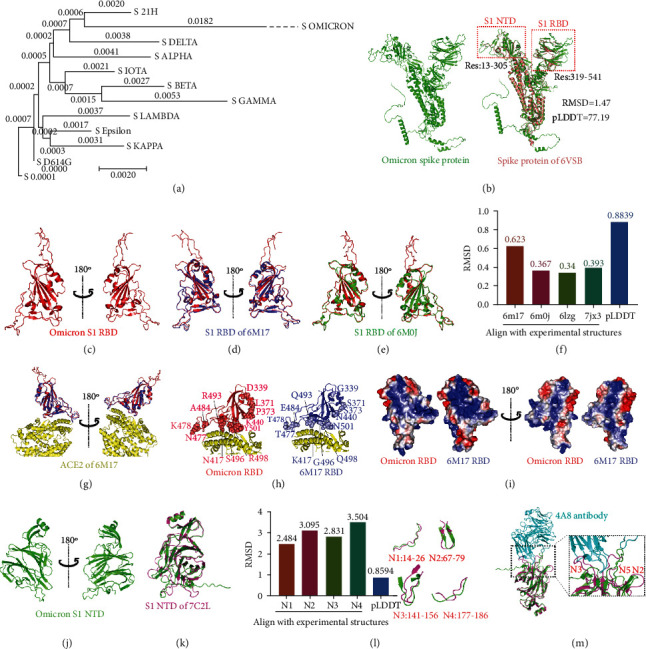
Figure 1.

(a) The phylogenetic analysis of all SARS-CoV-2 variants based on the spike protein sequence. The sequences were downloaded from GSAID (http://nextstrain.org/sars-cov-2). (b) The predicted structure of the Omicron variant. The comparison of spike protein between the Omicron variant and experimental structure (PDB: 6VSB). (c) The S1 RBD structure of Omicron variant. (d) The alignment of S1 RBD structure between Omicron variant and experimental structure (PDB: 6M17). (e) The alignment of S1 RBD structure between Omicron variant and experimental structure (PDB: 6M0J). (f) The RMSD values of S1 RBD between Omicron variant and experimental structures (PDB: 6M17, 6M0J, 6LZG, and 7JX3). The pLDDT value of the predicted S1 RBD structure was divided by 100. (g) The analysis of interactions between S1 RBD and ACE2. Red and blue indicate the S1 RBD of Omicron and 6M17, respectively. (h) The amino acid mutations on the Omicron S1 RBD. (i) The comparison of surface charge properties on S1 RBD between the Omicron variant and the experimental structure (PDB: 6M17). Red and blue colors on the surface indicate negative and positive charges, respectively. (j) The S1 NTD structure of the Omicron variant. (k) The comparison of S1 NTD between the Omicron variant and the experimental structure (PDB: 7C2L). (l) The RMSD values of the loop N1-4 between NTD and experimental structure (PDB: 7C2L). The pLDDT value of the predicted S1 NTD of the Omicron variant was divided by 100. The structural comparison of the S1 NTD loop N1-4 can be seen displayed on right. (m) The analysis of interactions between S1 NTD with 4A8 antibody (PDB: 7C2L).
