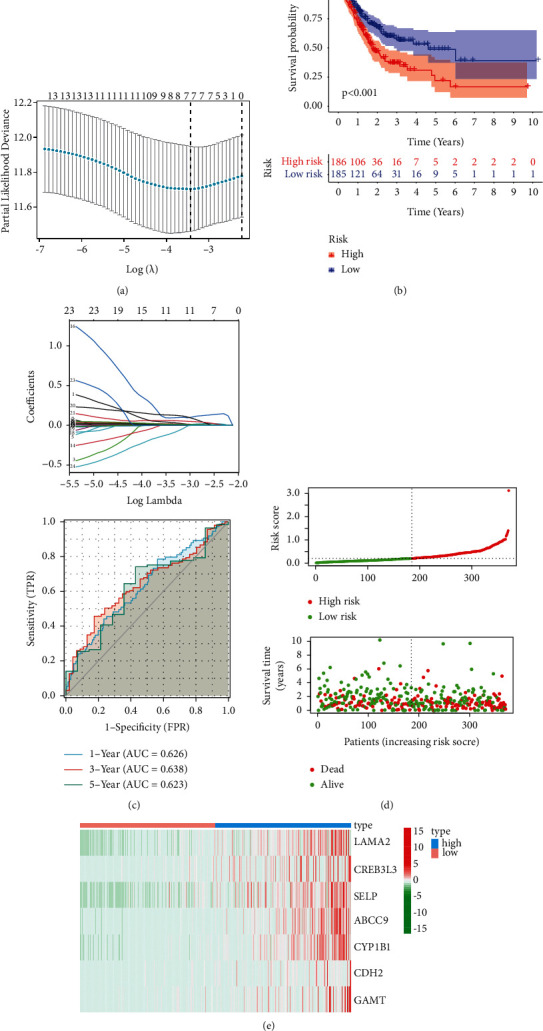
Figure 2.

Risk score for DRR-related gene correlated with prognosis of GC patients. (a) LASSO analysis revealing the minimal lambda. (b) Survival status and risk score. (c) Time-dependent ROC curve. (d) Survival curve illustrating the overall survival of the GC patients. (e) Heatmap visualizing the expression pattern of the seven-candidate DRR-related genes.
