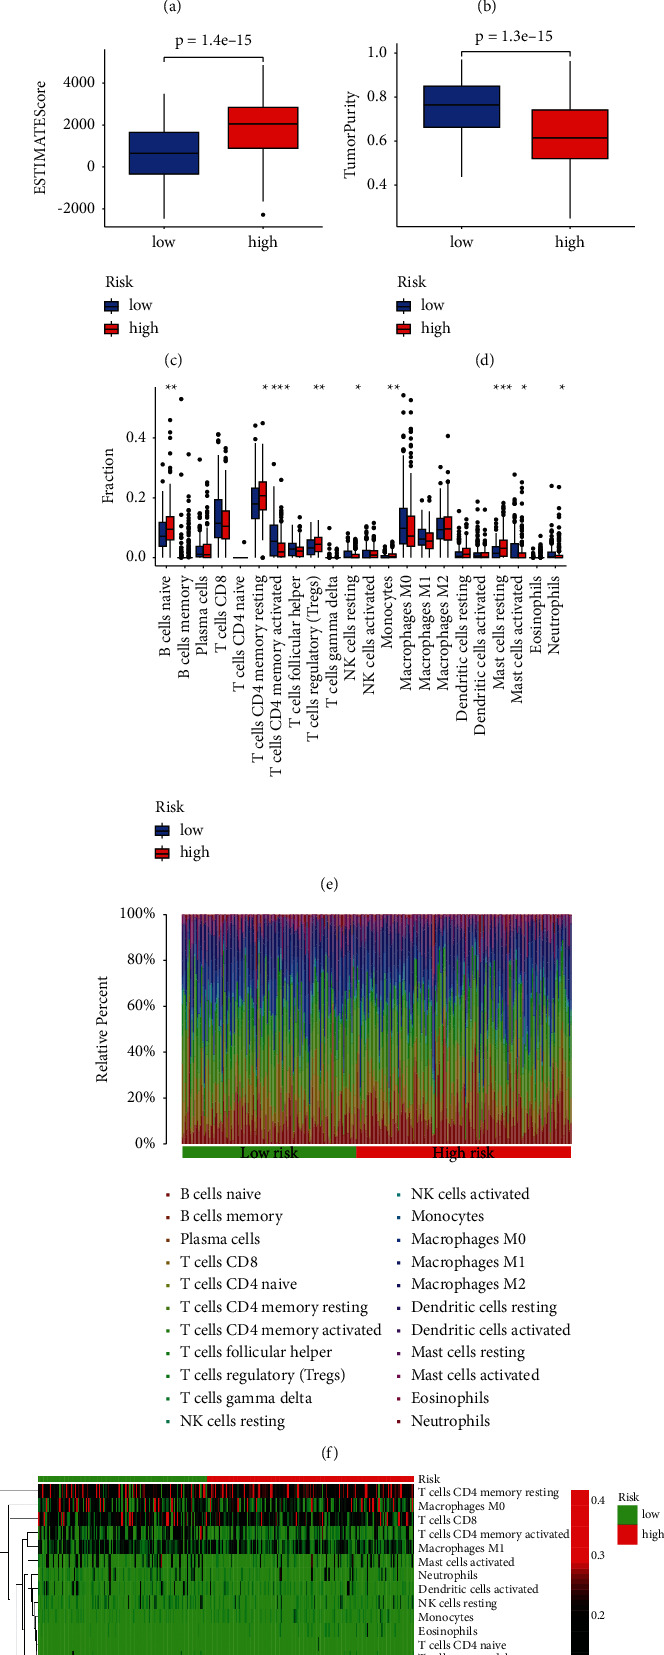
Figure 6.

Correlation between prognostic model and immune microenvironment. (a–d) GC patients with high-risk scores have higher ImmuneScore, StromalScore, and ESTIMATEScore than those with low-risk scores. (e) The infiltrating levels of 22 immune cell types in high/low subtypes in the GC. (f) The relative proportion of immune infiltration in high/low-risk groups. (g) The landscape of immune cell infiltration between high/low-risk subtypes. ∗p < 0.05, ∗∗p < 0.01, and ∗∗∗p < 0.001.
