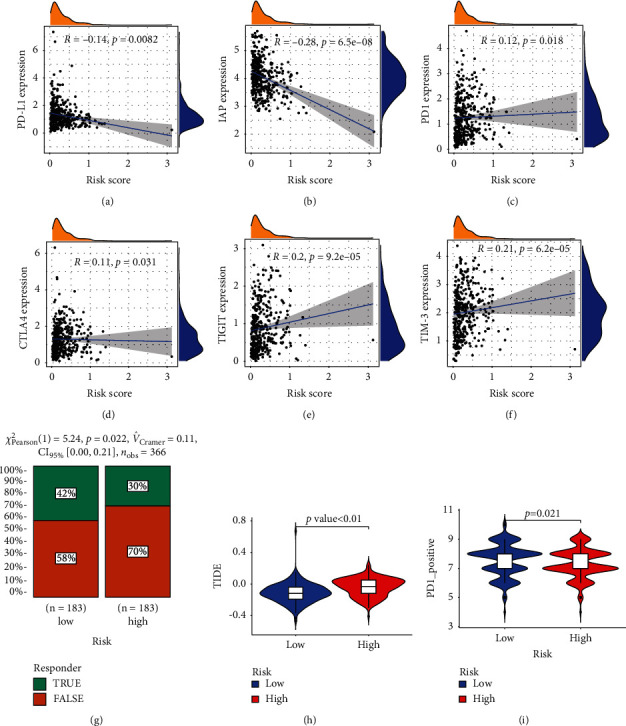
Figure 7.

The estimation of two prognostic subtypes in immunotherapy response. (a–f) The expression of six immune checkpoint molecules (PD-L1, IAP, PD1, CTLA4, TIGIT, and TIM-3) in two prognostic subtypes. (g) Chi-squared test plot for immunotherapy in the responder. (h-i) Violin diagram showing the differential TIDE and TCIA between the high/low-risk groups.
