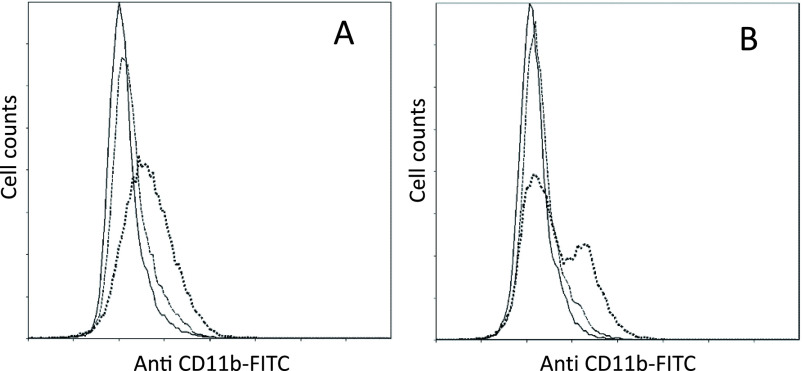
Figure 3.
Results of flow cytometry showing inositol hexaphosphate-induced CD11b expression
In A) PLB-985 and B) X chromosome linked gp91-phox gene knockout cells following incubation with 0 mM (solid line), 5 mM (broken line), and 10 mM (dotted line) inositol hexaphosphate for 72 h. Each histogram shows the CD11b level (measured as signal intensity of antibody fluorescein isothiocyanate) on the X-axis versus cell count on the Y-axis.

