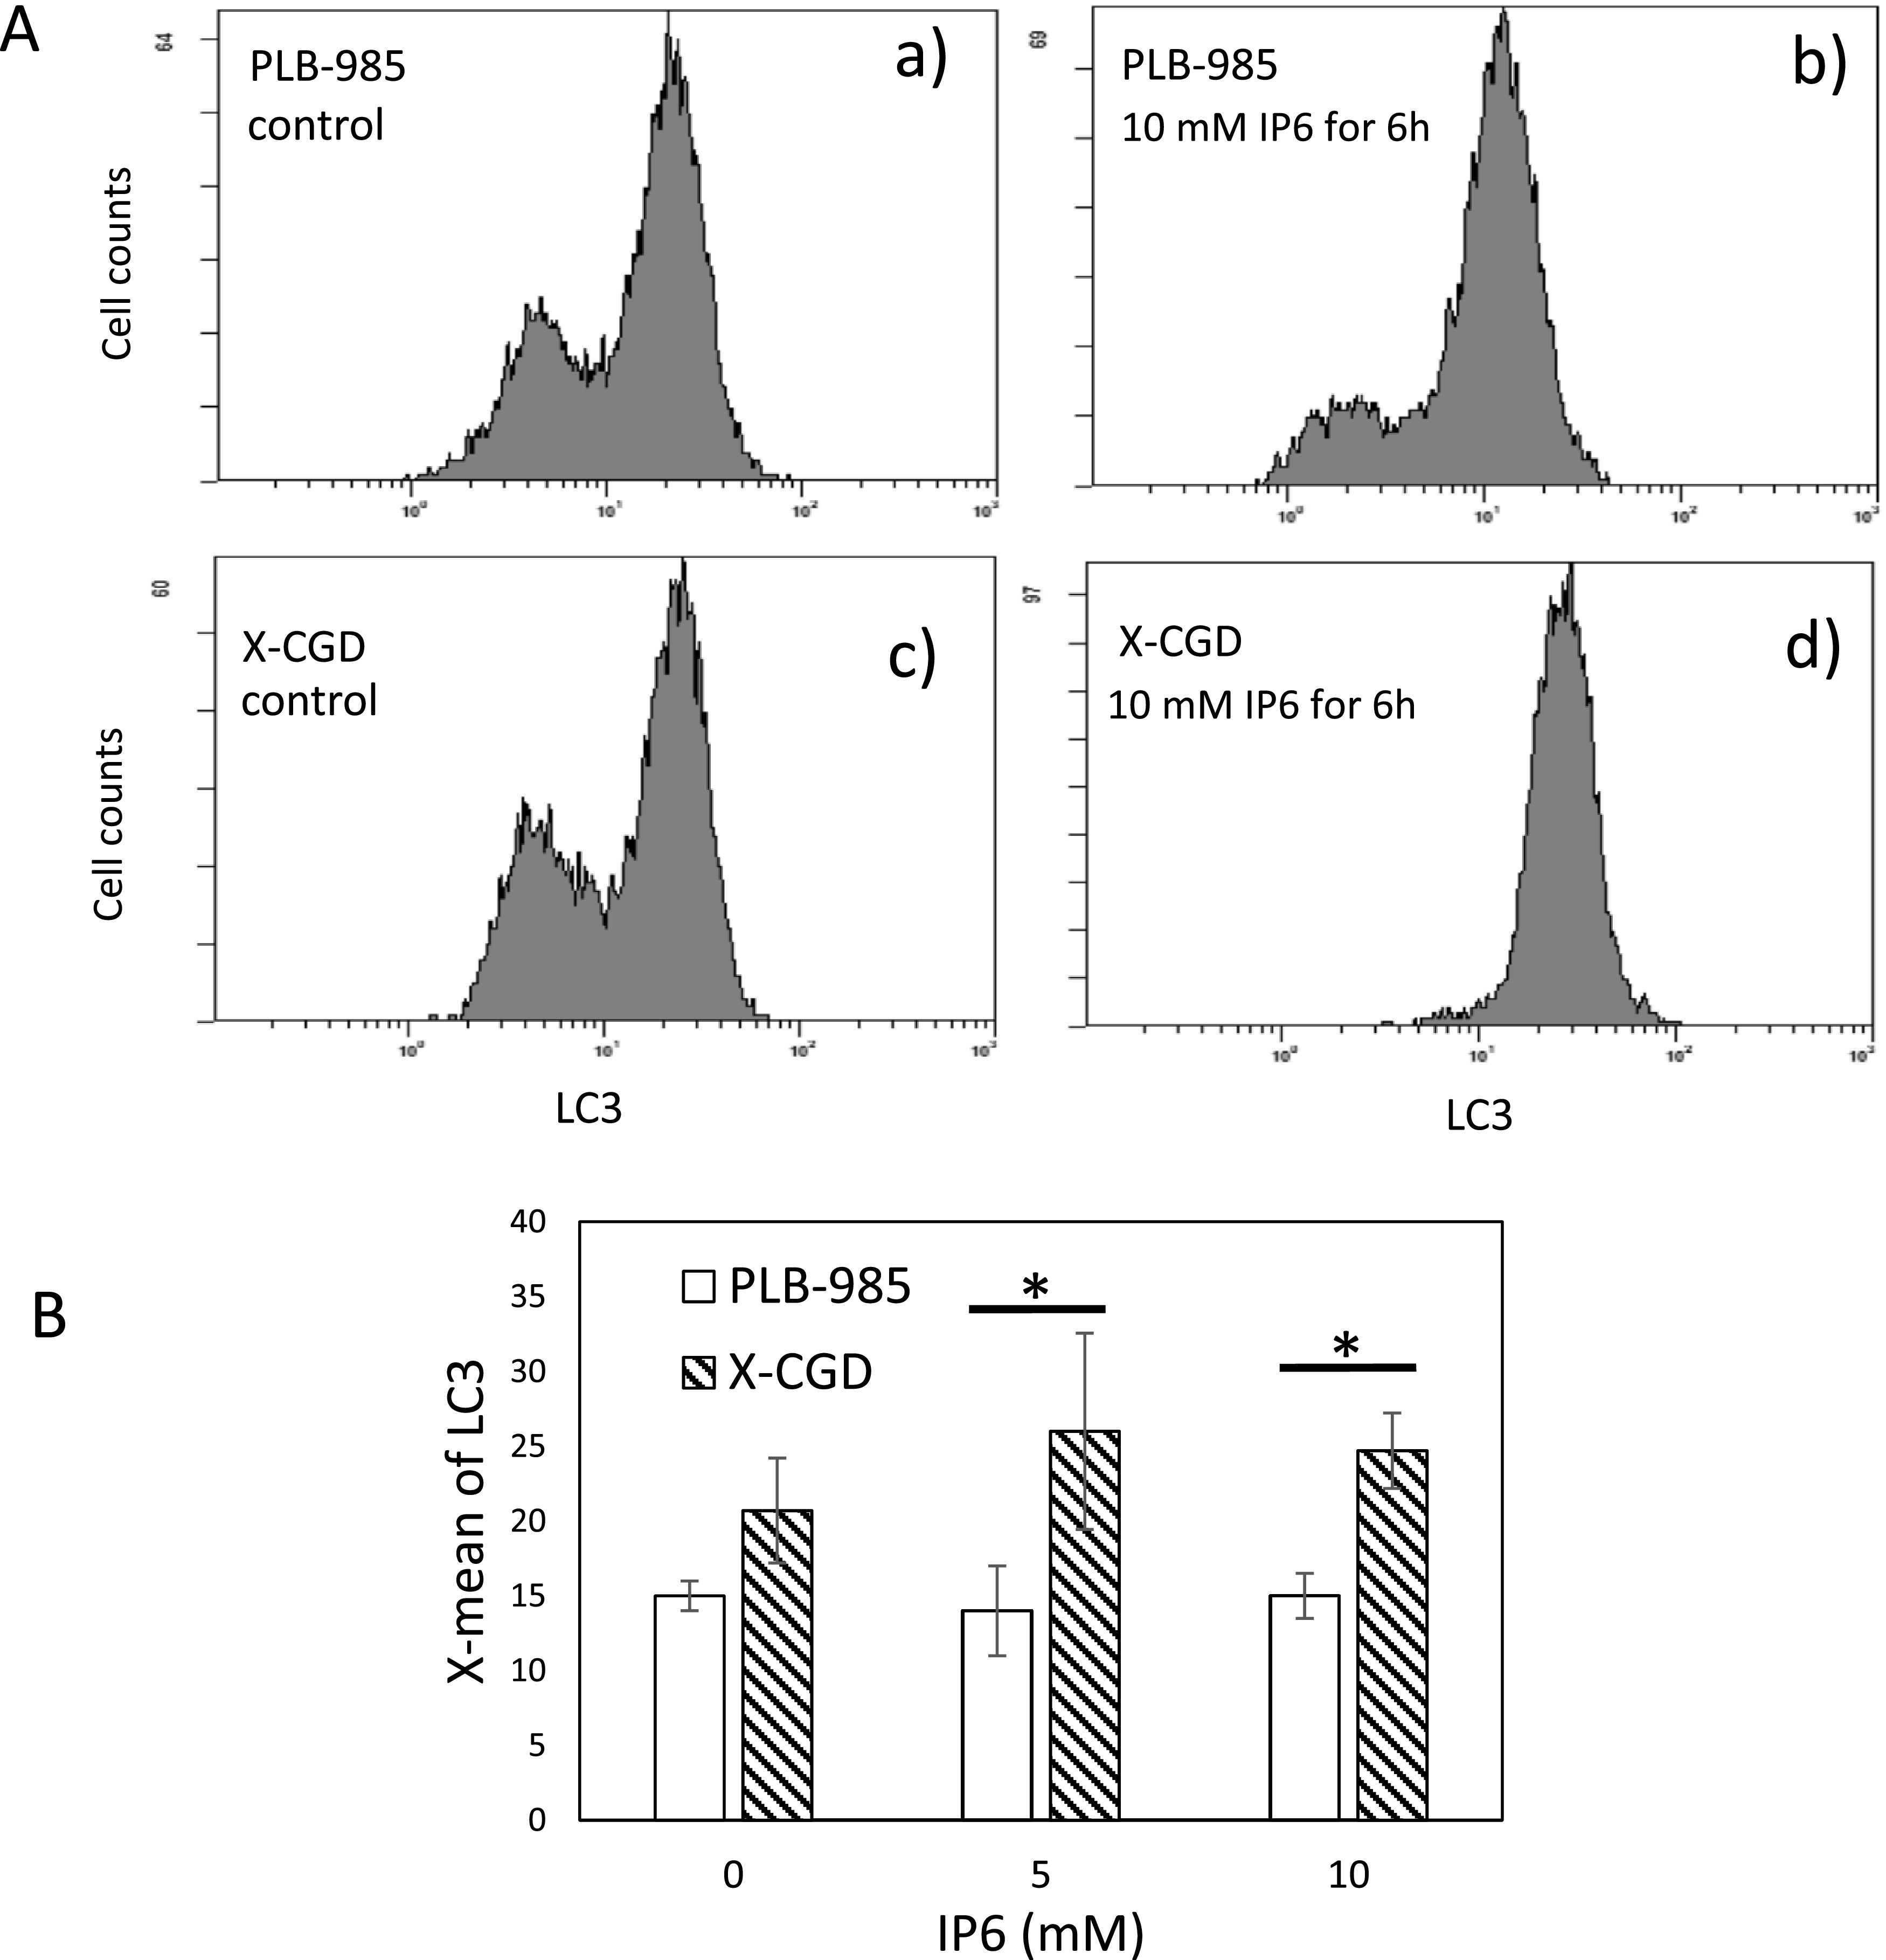
Figure 4.

Detection of LC3 levels with flow cytometer
A) Typical flow cytometry histogram of cells treated with 10 mM inositol hexaphosphate. Each histogram shows the LC3 levels (measured as signal intensity of the secondary antibody IgG-fluorescein isothiocyanate) on the X-axis versus cell count on the Y-axis. B) The average value (X-mean) of LC3 level calculated from the flow cytometry of the cells treated with 5 and 10 mM inositol hexaphosphate for 6 h obtained from three independent experiments. *P<0.05 (Student’s t-test).
