FIGURE 5.

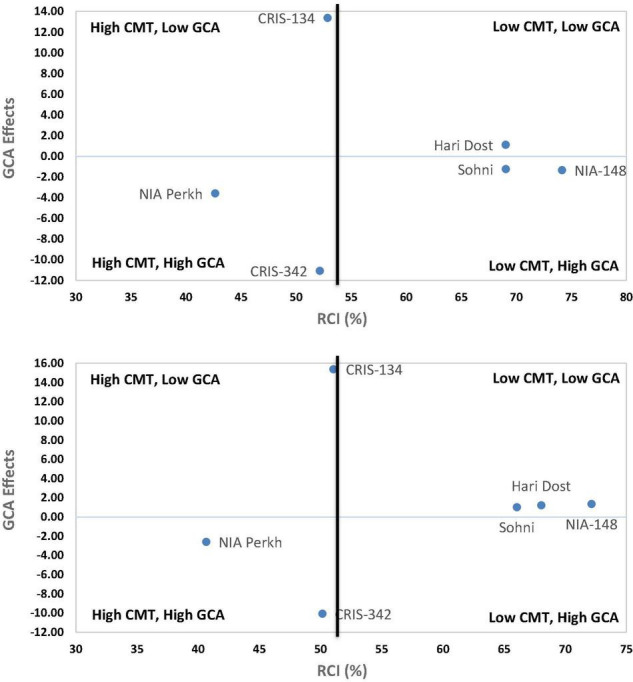
Scatter diagram between RCI% and general combining ability (GCA) effects in upland cotton genotypes (parents) in the glasshouse (up) and field (down) data based on F1 generation.

Scatter diagram between RCI% and general combining ability (GCA) effects in upland cotton genotypes (parents) in the glasshouse (up) and field (down) data based on F1 generation.