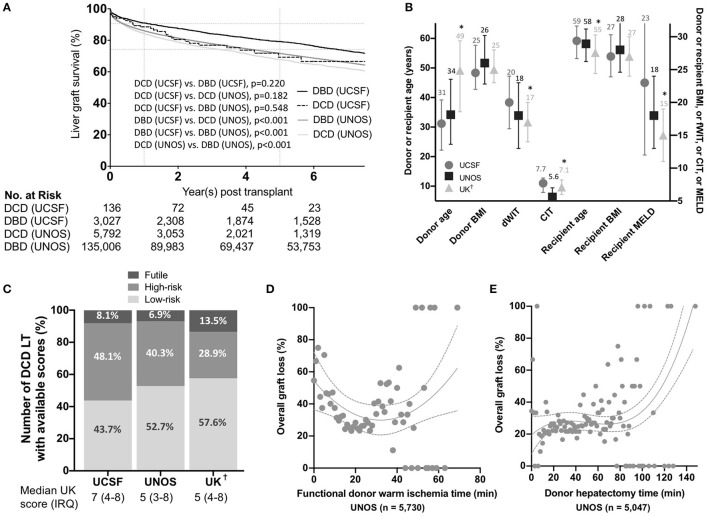
Figure 1.
(A) Overall liver graft survival. Kaplan-Meier survival curves showing liver graft survival for donation after circulatory death (DCD) and donation after brain death (DBD) liver transplantation in the University of California, San Francisco (UCSF) and United Network for Organ Sharing (UNOS) cohorts. P-values were calculated using the Log-Rank test. Key variables and score values in the different US and UK cohorts. (B) Donor and recipient variables in the University of California, San Francisco (UCSF), United Network for Organ Sharing (UNOS), and United Kingdom (UK) cohorts. Median and interquartile ranges are shown. P-values were estimated using two-way ANOVA tests assuming a normal distribution. *denote a p < 0.05 compared to the UCSF group. (C) Percentages of donation after circulatory death (DCD) liver transplants (LT) in each category (i.e. low-risk, high-risk and futile) in the UCSF, UNOS, and UK cohorts (Percentages were calculated excluding missing score data to obtain a visual comparison between the three groups). Variation in overall graft loss along with donor warm ischemia time (D) and donor hepatectomy time (E). Interpolations were performed using third-order polynomial equations. BMI, Body mass indexI; dWIT, Donor warm ischemia time; CIT, Cold ischemia time; MELD, Model for End-Stage Liver Disease-Sodium. As reported by Schlegel et al. (5)

