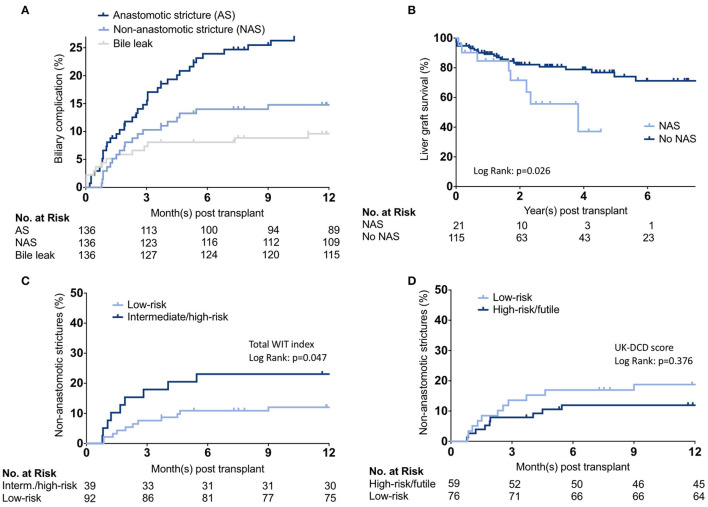
Figure 4.
Biliary complication analysis. (A) Cumulative incidence estimates of anastomotic and non-anastomotic biliary strictures and bile leaks. (B) Kaplan-Meier survival curves representing liver graft survival estimates between recipients who developed non-anastomotic biliary strictures vs. those who did not. (C,D) Cumulative incidence estimates of non-anastomotic biliary strictures stratified by total WIT index or UK-DCD-score. WIT, Warm ischemia time.

