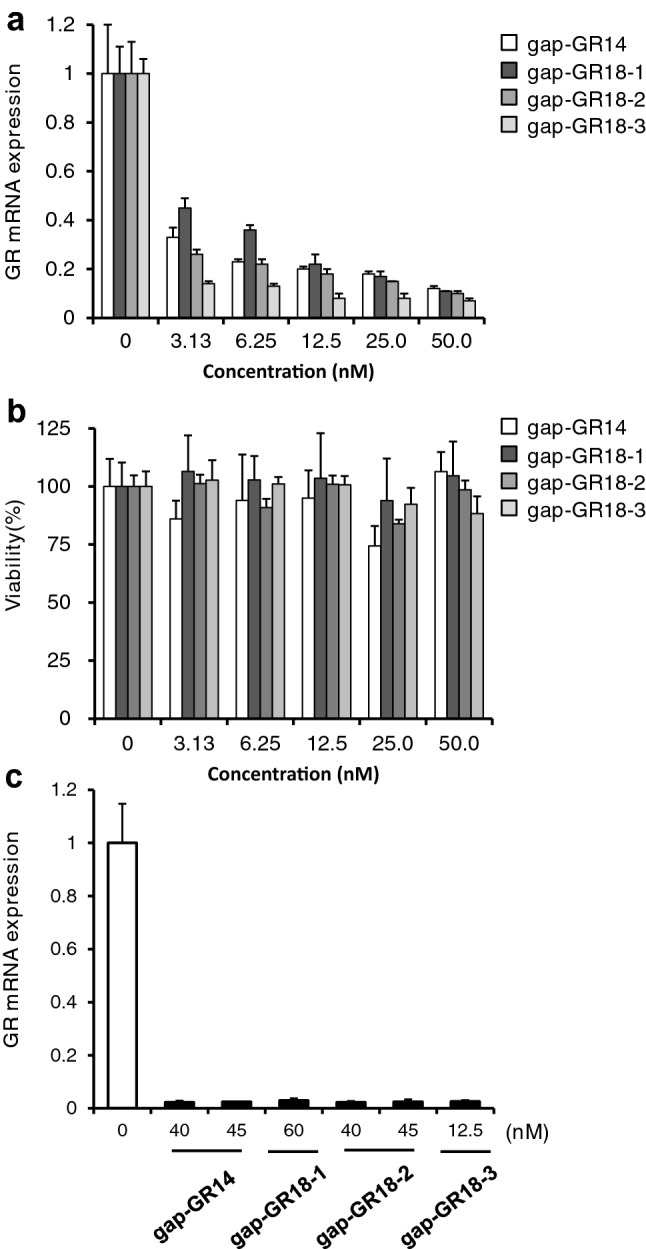
Fig. 3.

The mRNA expression level of glucocorticoid receptor (GR) and cell viability. a The mRNA expression level of the target gene (GR) in cells treated with each antisense oligonucleotide (ASO) at a concentration in the range of 3.13–50 nM by qRT-PCR. b The cell viability evaluation in cells treated with each ASO at a concentration in the range of 3.13–50 nM by WST-assay. c The mRNA expression level of GR in cells treated with each ASO at concentrations of 40 nM and 45 nM for gap-GR14, 60 nM for gap-GR18-1, 40 nM and 45 nM for gap-GR18-2, and 12.5 nM for gap-GR18-3 by qRT-PCR. The bar graph shows the mean ± standard deviation (n = 4)
