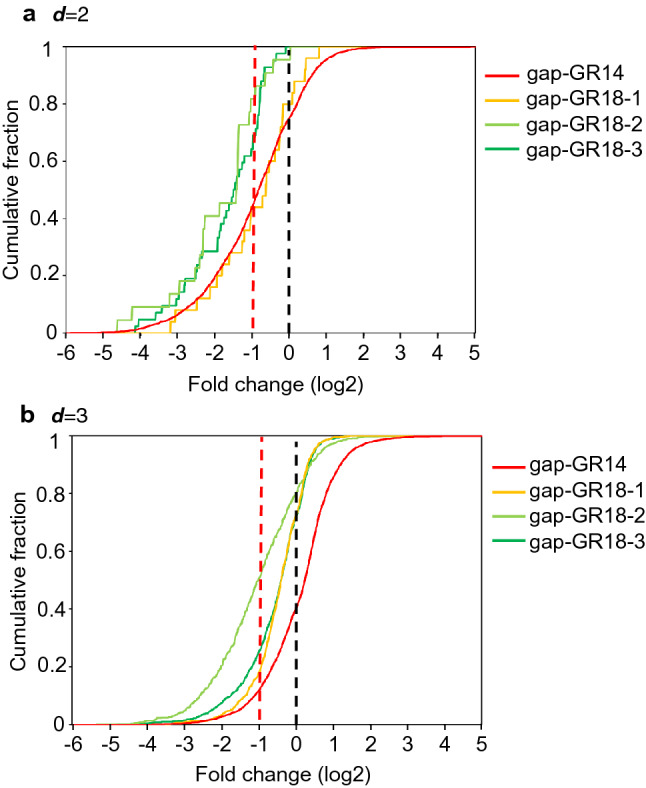
Fig. 6.

Cumulative plot. Cumulative plot from microarray analysis of the cells treated with gap-GR14, gap-GR18-1, gap-GR18-2, and gap-GR18-3 ASO. The cumulative number of genes is shown on the vertical axis, and the proportion of change in a d = 2 and b d = 3 off-target gene expression due to introduction of the gap-GR14 (red line), gap-GR18-1 (orange line), gap-GR18-2 (green line), and gap-GR18-3 (yellow green line) ASO (expressed logarithmically, respectively) is shown on the horizontal axis
