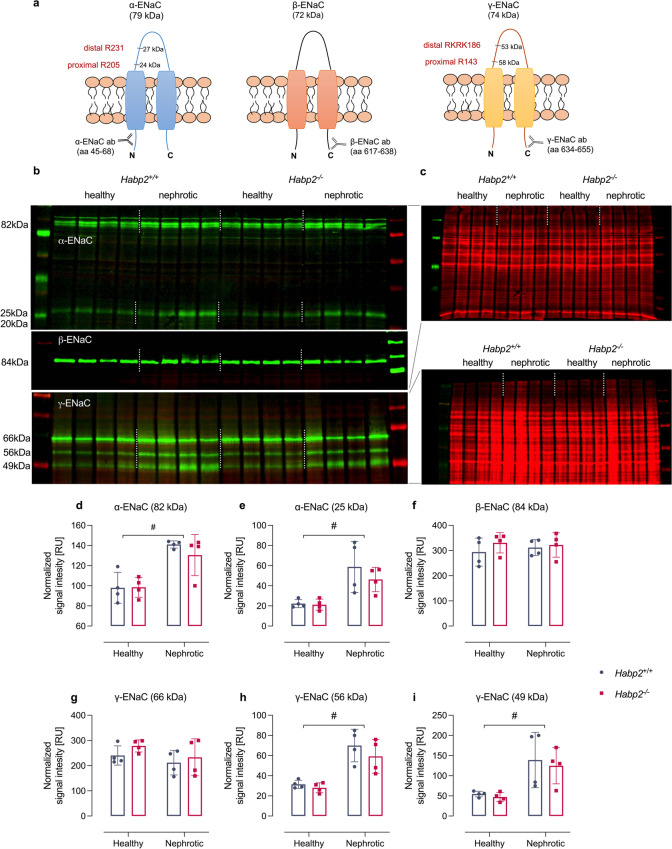
Fig. 5.
Renal expression of ENaC subunits in experimental nephrotic syndrome. a Localization of the immunogenic sequences of the used antibodies against murine α-, β-, and γ-ENaC. In α- and γ-ENaC, the proximal and distal cleavage sites (designated from the N-terminus, respectively) are depicted. The antibody against N-terminal α-ENaC is supposed to detect full-length α-ENaC at 79 kDa (699 aa) and two N-terminal fragments with a mass of 27 kDa (231 aa) and 24 kDa (205 aa). The antibody against C-terminal β-ENaC is supposed to detect full-length β-ENaC at 72 kDa (638 aa). The antibody against C-terminal γ-ENaC is supposed to detect full-length γ-ENaC at 74 kDa (655 aa) and C-terminal fragments with a mass of 58 kDa (512 aa) after proximal cleavage and at 53 kDa (469 aa) after distal cleavage, respectively. Mass values are calculated from the amino acid sequences (omitting any N-glycosylations). b Western blots showing the expression of ENaC subunits in a plasma membrane preparation of kidney cortex from Habp2+/+ and Habp2−/− mice. α- and β-ENaC expression were analyzed in native samples on a 4–15% gradient gel after stripping, γ-ENaC expression was analyzed after deglycosylation of the same samples on an 8% gel. The higher molecular mass for α- and β-ENaC stems from N-glycosylation. c Total protein stain for control of loading and blotting. d–i Densitometry of the obtained bands normalized for total protein content of each lane (n = 4 each). #Significant difference between healthy and nephrotic state (two-way ANOVA)

