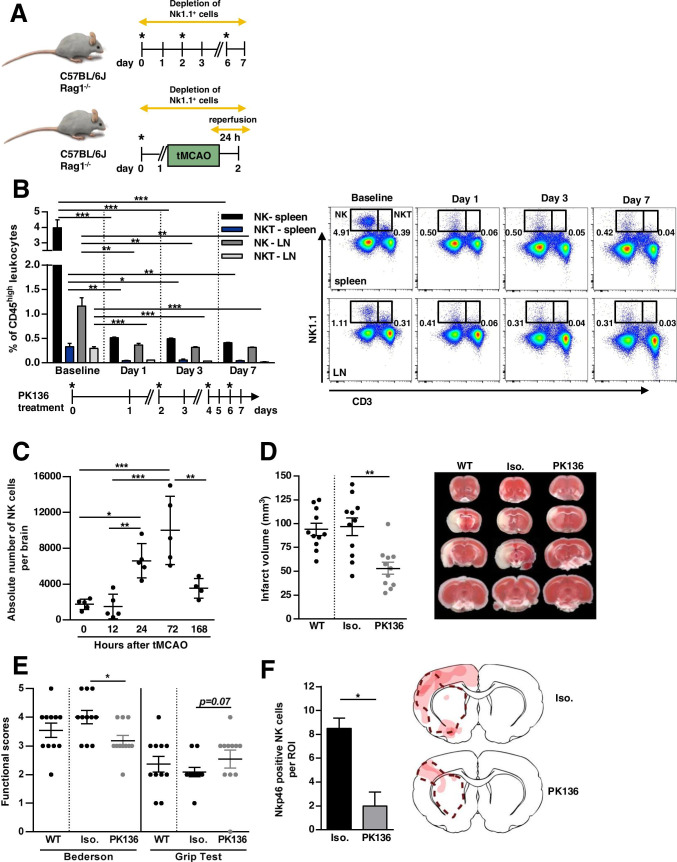
Fig. 2.
In vivo depletion of natural killer (NK) and natural killer T (NKT) cells with an anti-NK1.1 antibody (PK136). A Schematic illustration of in vivo depletion of Nk1.1+ cells in wildtype (WT, C57BL/6) and Rag1−/− mice. Upper panel: Mice were injected intraperitoneally every second day with 300 µg of NK1.1-specific monoclonal antibody (clone PK136, *). The control group was given similar doses of the respective isotype. We confirmed the depletion by flow cytometric analysis of leukocyte subpopulations isolated from lymph nodes (LN) and spleen, 24 h to 7 days after first PK136 administration (see Fig. 3B + C). Lower panel: 24 h prior to focal ischemia by transient middle cerebral artery occlusion (tMCAO), mice were injected intraperitoneally with 300 µg of NK1.1-specific monoclonal antibody (*). Ischemia was induced by 60 min of tMCAO. Twenty-four hours after stroke onset, behavioral tests and infarct volume assessment was performed. B Sustained effect of NK and NKT cell depletion in spleen and LN of WT mice after administration of PK136 (given as the percentage of CD45high leukocytes). Days of treatment are outlined in the timeline below the figure. Mice were injected intraperitoneally with 300 µg of NK1.1-specific monoclonal antibody (*). Exemplary flow cytometric staining of LN and spleen derived from WT mice gated for T cells (CD3+NK1.1−), NKT cells (CD3+NK1.1+), and NK cells (CD3−NK1.1+) at baseline, and 1, 3, and 7 days after NK1.1+ cell depletion is depicted. C Time course of NK cell infiltration after 60 min of tMCAO in mice: Flow cytometry of the whole brain derived from WT mice 0, 12, 24, 72, and 168 h post-stroke. D Quantification of the infarct volume in WT mice without any treatment (WT) and WT mice treated with either anti-NK1.1 antibody (PK136) or isotype control (Iso.). Representative images of the infarct volume are depicted using 2,3,5-triphenyltetrazolium chloride (TTC) staining. E Functionally behavioral scores, namely Bederson and grip test in WT, Iso. and PK136 mice 24 h after focal cerebral ischemia are shown. F The number of NK cells in the ischemic hemisphere (region of interest: ROI) of Iso. and PK136 animals 24 h after 60-min tMCAO are compared by immunofluorescence staining of Nkp46 (right). Nkp46-positive NK cells of the whole ischemic hemisphere were counted in two coronal cryosections of each animal, and the mean value of both sections was calculated per animal. Spatial localization of NK cells in the ischemic hemisphere is shown by a heat map (left). The more intense the red coloration, the more NK cells could be found in this area. The dashed line indicates the infarct area in the both treatment groups

