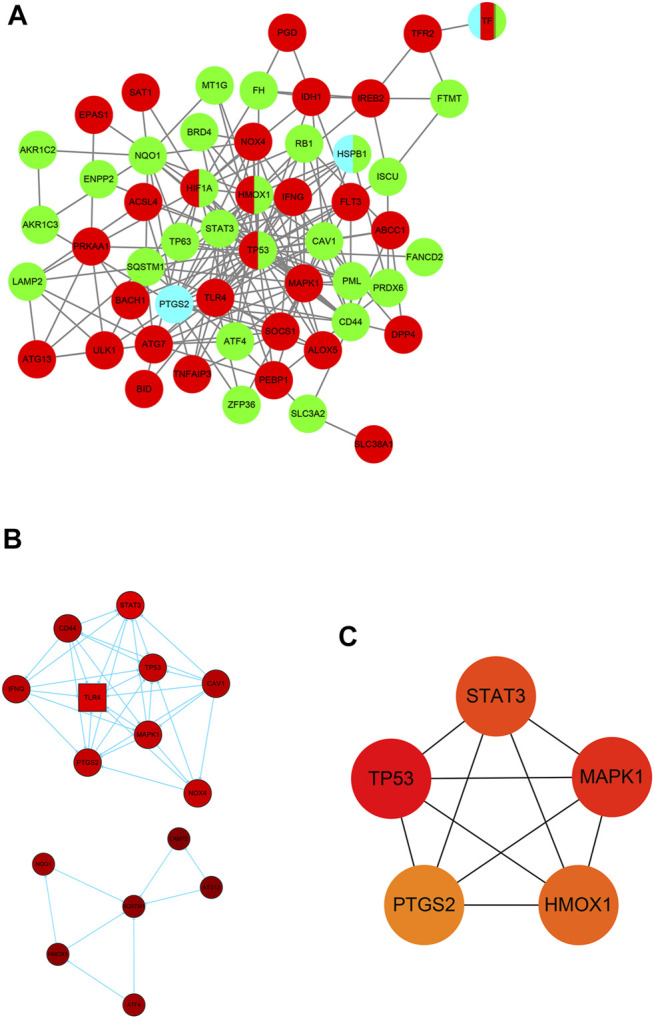
FIGURE 4.

Identification of five hub ferroptosis-related genes (FRGs). (A) Protein–protein interaction (PPI) network of 59 differentially expressed FRGs (DE-FRGs). Red indicates the driver of ferroptosis, light blue indicates the marker of ferroptosis, and green indicates the suppressor of ferroptosis. (B) Two clusters of the PPI network. (C) Hub genes calculated using the maximum neighborhood component (MNC), degree, and edge percolated component (EPC) algorithms.
