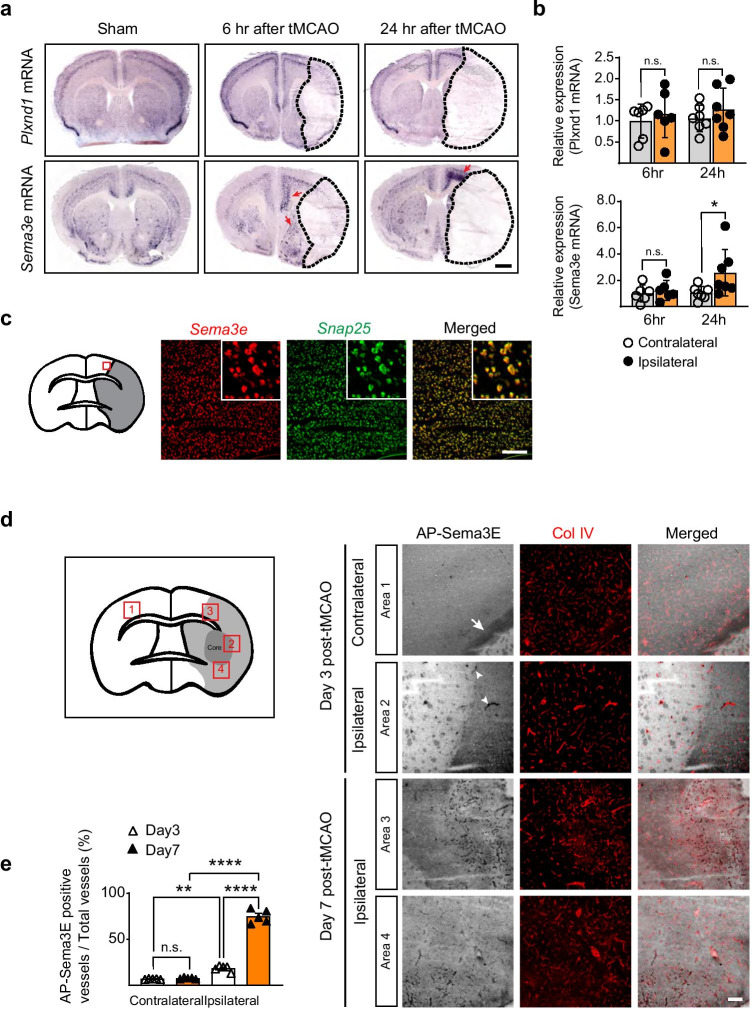
Fig. 1.
Sema3e is rapidly expressed in neurons in the peri-infarct region, whereas Plxnd1 is induced in the remodeling vasculature a In situ hybridization of Sema3e and Plxnd1 at 6 and 24 h after tMCAo. The expression of Sema3e mRNA (red arrows), but not Plxnd1 mRNA, was increased in the peri-infarct region. Dotted lines mark regions damaged by tMCAo. Scale bar = 1 mm. b Real-time qPCR for quantitative analysis of mRNA expression in the peri-infarct tissue at 6 and 24 h after tMCAo (n = 6 mice/6 h group, n = 7 mice/24 h group). Data are shown as mean ± SEM. *p < 0.05; two-tailed Student’s t-test. c Double fluorescence ISH shows colocalization of Sema3e (red) and snap25 (green) mRNA in the tissue adjacent to the ischemic region at 24 h after tMCAo. The red box indicates the analyzed brain area, insets are high-resolution images. Scale bar = 100 μm. d AP-Sema3E binding assay to detect Plexin-D1 expression in brain sections (black, left panels) on days 3 and 7 post-tMCAo, and vessels visualized by subsequent collagen IV (Col IV) immunostaining to detect blood vessels (red, middle panels). Three days after ischemic damage, Plexin-D1-positive vessels (white arrowheads) began to appear on the ipsilateral side, whereas no Plexin-D1 expression was observed on vessels other than those of the neuronal tracts (white arrow) on the contralateral side. Seven days post-tMCAo, most vessels around the damaged region expressed Plexin-D1 (bottom two rows). Numbers in the red boxes indicate image order from top to bottom: 1, contralateral cortex; 2, near core damaged region; 3, peri-infarct region in the ipsilateral cortex; 4, near damaged core in the ipsilateral area. The light-colored area lacking vessels followed by AP-Sema3E binding was defined as the ischemic core (see also Supplemental Fig. 2). Scale bar = 100 μm. e Quantification from (d). (three brain sections per mouse, n = 5 mice/group). Data are shown as mean ± SEM. **p < 0.01, ****p < 0.0001; one-way ANOVA with Tukey’s multiple comparisons

