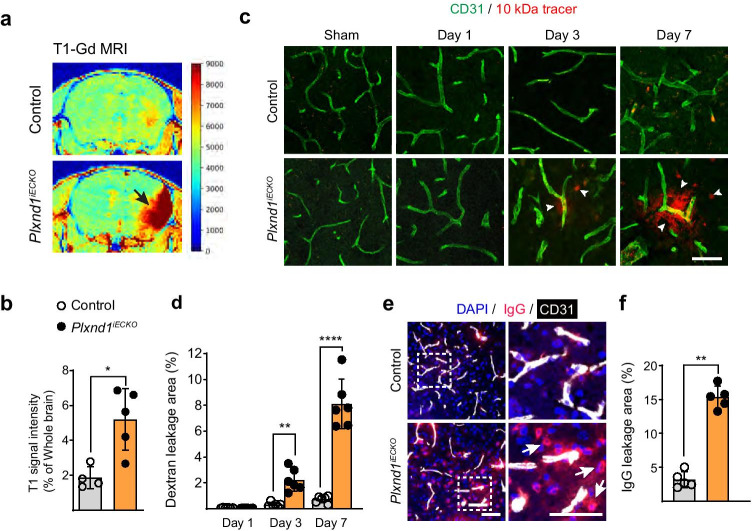
Fig. 5.
BBB breakdown during ischemia-induced vessel remodeling in Plxnd1 knockout mice. a Representative T1-Gd MRI image. Intensity of signal change between control (Cre positive Plxnd1flox/+) and Plxnd1iECKO mouse brain parenchyma (jet image colormap). Black arrows indicate penetrable Gd-DOTA distribution in the Plxnd1iECKO mice. b Quantitative analysis showing that Gd-DOTA enhancement was increased in the brain parenchyma of Plxnd1iECKO mice, indicating increased BBB permeability (n = 4 mice/control group, n = 5 mice/Plxnd1iECKO group). Open and closed circles in black indicate control and Plxnd1iECKO mice, respectively (graphs in b, d, f). c Confocal microscopy imaging of 10-kDa dextran tracer (red) around CD31-positive capillaries (green) in control (top panels) and Plxnd1iECKO (bottom panels) mice. Considerable tracer leakage into the brain parenchyma of Plxnd1iECKO mice appeared as early as post-tMCAo day 3, whereas permeability in the control mice was barely detectable. Arrowheads indicate accumulated tracer in perivascular tissues. Scale bar = 50 μm. d Quantification of vascular permeability (n = 6 mice/group). Tracer accumulated areas were analyzed as the relative percentage of sham control (Cre positive Plxnd1flox/+ without stroke induction) values. e Immunostaining of IgG (red) and CD31 (white) at post-tMCAo day 7. Dotted boxes in the left panels are shown in high-resolution images on the right panels. The white arrows indicate accumulated leak IgG in the brain parenchyma of Plxnd1iECKO mice. Scale bar = 100 μm. f Quantification of IgG-stained areas (n = 5 mice/group). Data are shown as mean ± SEM. *p < 0.05, **p < 0.01, ****p < 0.0001; two-tailed Student’s t-test (graphs in b and f) and two-way ANOVA with Tukey’s multiple comparison (graph d)

