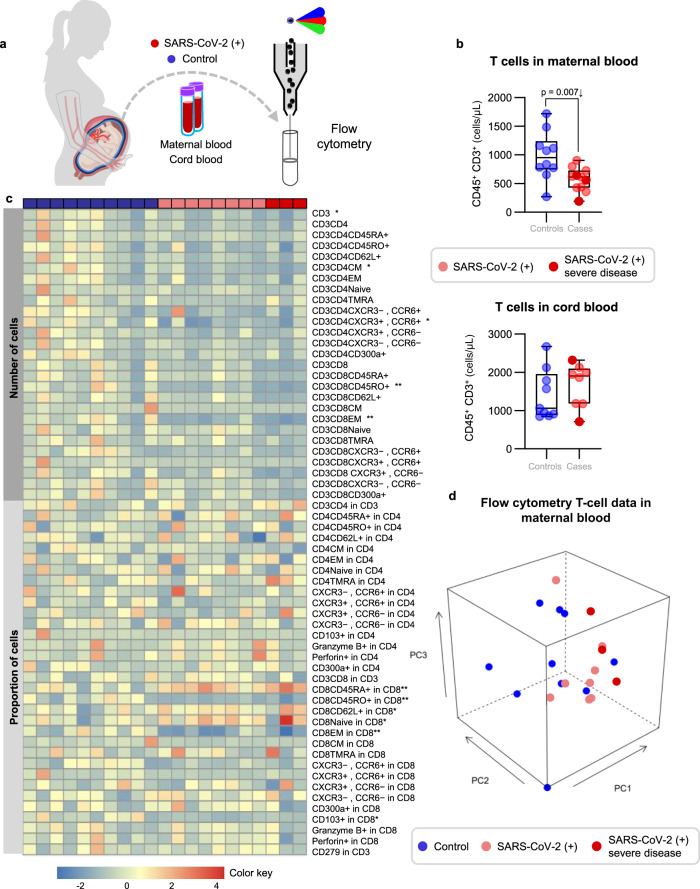
Fig. 2. Immunophenotyping of T cells in the maternal and cord blood of women with SARS-CoV-2 infection and their neonates.
a Maternal blood and cord blood were collected for immunophenotyping. b Numbers of T cells in the peripheral blood [n = 10 control, 11 SARS-CoV-2 (+)] and cord blood [n = 9 control, 8 SARS-CoV-2 (+)]. Data are shown as boxplots where midlines indicate medians, boxes indicate interquartile range and whiskers indicate minimum/maximum range. Differences between groups were evaluated by Mann–Whitney U-tests. P values < 0.05 were used to denote a significant result. Blue dots indicate control women, light red dots indicate SARS-CoV-2 (+) women, and dark red dots indicate women with severe COVID-19. c Heatmap showing the abundance (z-scores) of T-cell subsets in the maternal blood from SARS-CoV-2 (+) or control women [n = 10 control, 11 SARS-CoV-2 (+)], where cell numbers and proportions are shown. Differences between groups were assessed using two-sample t-tests. P values were adjusted for multiple comparisons using the false-discovery rate (FDR) method to obtain q values. *q < 0.1; **q < 0.05. Red and blue indicate increased and decreased abundance, respectively. d Three-dimensional scatter plot showing the distribution of flow cytometry data. Blue dots indicate control women, light red dots indicate SARS-CoV-2 (+) women, and dark red dots indicate women with severe COVID-19 [n = 10 control, 11 SARS-CoV-2(+)] based on principal component (PC)1–PC3.

