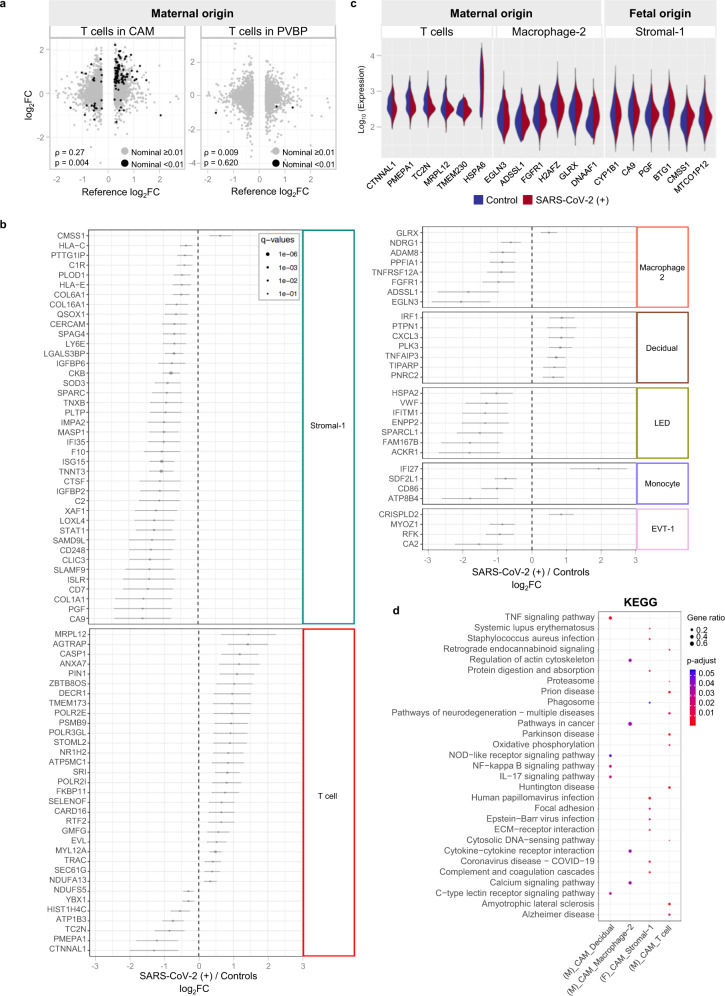
Fig. 5. Single-cell characterization of major cell clusters in the chorioamniotic membranes (CAM) and placental villi and basal plate (PVBP) of women with SARS-CoV-2 infection.
a Scatter plots showing the effects of SARS-CoV-2 on gene expression [log2 fold change (FC)] in maternal T cells from the CAM and PVBP compared to a previously reported dataset (Meckiff et al., 2020). Black dots represent genes with nominal p < 0.01 in this study, which were used to calculate Spearman’s correlation. b Forest plots showing the log2(FC) of differentially expressed genes (DEGs) associated with SARS-CoV-2 infection in Stromal-1, T cell, Macrophage-2, decidual, lymphoid endothelial decidual cell (LED), Monocyte, and extravillous trophoblast (EVT-1) cell types in the CAM and PVBP of SARS-CoV-2 (+) (n = 9) or control women (n = 10). DEGs shown are significant after false discovery rate (FDR) adjustment (q < 0.1). c Violin plots showing the distribution of single-cell gene expression levels for the top six DEGs in the maternal T cell, maternal Macrophage-2, and fetal Stromal-1 cell types in the CAM comparing SARS-CoV-2 (+) and control women. d Kyoto Encyclopedia of Genes and Genomes (KEGG) pathways enriched for DEGs in the maternal (M) cell types (decidual, T cells, and Macrophage-2) and fetal (F) Stromal-1 cell type from the CAM based on the over-representation analysis. A one-sided Fisher’s exact test was used. KEGG pathways with q < 0.05 were selected.

