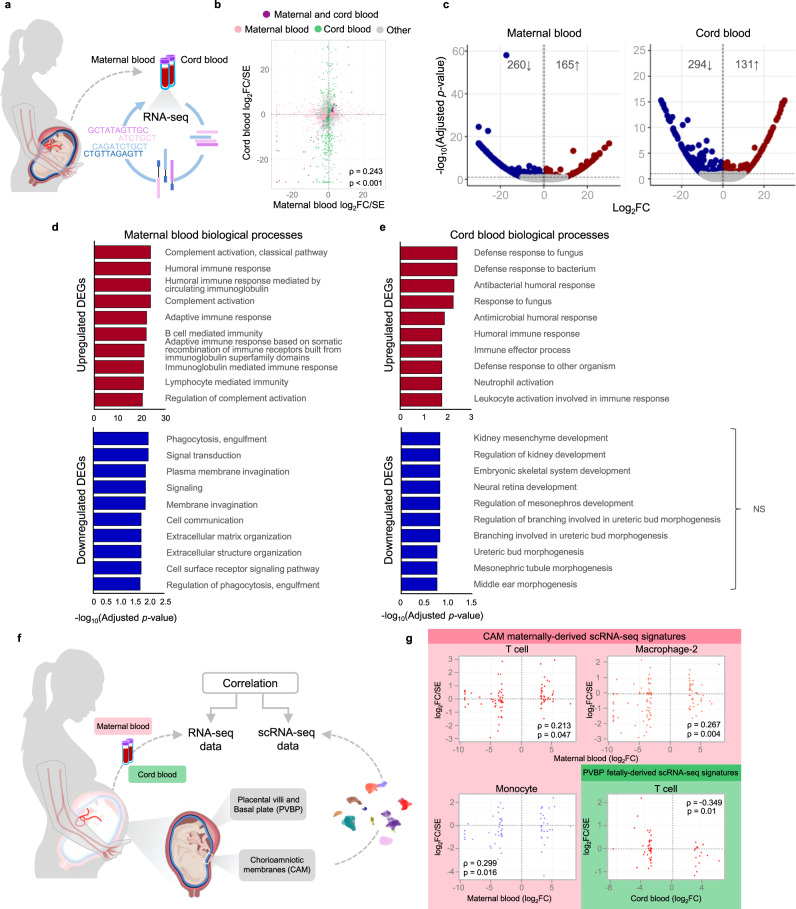
Fig. 6. Bulk transcriptomics in the maternal and cord blood of women with SARS-CoV-2 infection and their neonates.
a Maternal blood [n = 10 control, 11 SARS-CoV-2 (+)] and cord blood [n = 8 control, 9 SARS-CoV-2 (+)] were collected for RNA sequencing (RNA-seq). b Scatter plot showing the log2 fold changes (FC) identified between SARS-CoV-2 (+) and control women that are similar or different between the maternal blood (x-axis) and cord blood (y-axis). A two-sided Spearman’s correlation test was used. Each dot represents a gene tested (in pink DEG for the maternal blood only, in green DEG for the cord blood only, in purple DEG for both compartments and same direction, gray if otherwise not significant). c Volcano plots showing the adjusted p-values (-log10 thereof) on the y-axis and log2 fold change with SARS-CoV-2 infection on the x-axis in the maternal and cord blood. The number of upregulated and downregulated genes were determined based on fold change > 1.25 and adjusted p value < 0.1. Bar plots showing the top 10 over-represented biological processes from the Gene Ontology (GO) database based on upregulated (top panel; red bars) and downregulated (bottom panel; blue bars) DEGs associated with SARS-CoV-2 infection with adjusted p value < 0.05 in the d maternal blood and e cord blood. NS not significant. The p-values were computed based on one-sided hypergeometric distribution and adjusted by false-discovery rate. f Comparative analyses were performed between bulk transcriptomic data of the maternal blood and cord blood and scRNA-seq data from the placental tissues using DEG from the bulk analysis (q < 0.1). g Scatter plots (pink boxes) showing cell-type-specific Spearman correlations between bulk RNA-seq data from the maternal blood and scRNA-seq data from the chorioamniotic membranes (CAM) for the T cell, Macrophage-2, and Monocyte populations of maternal origin. A two-sided Spearman’s correlation test was used. Scatter plot (green box) showing the cell type-specific Spearman correlation between bulk RNA-seq data from the cord blood and scRNA-seq data from the placental villi and basal plate (PVBP) for the T cell population of fetal origin.

