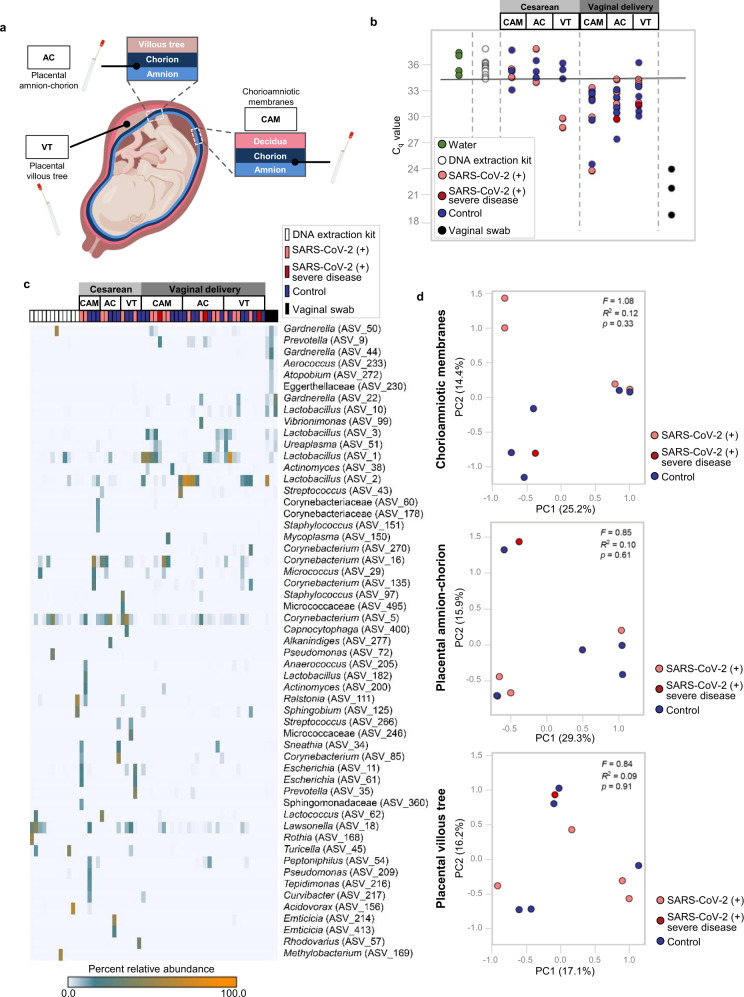
Fig. 8. Bacterial DNA profiles of the placental tissues from women with SARS-CoV-2 infection.
a Schematic representation of sampling locations from the chorioamniotic membranes (CAM), amnion–chorion interface of the placenta (AC), and within the placental villous tree (VT) from SARS-CoV-2 (+) women who delivered by cesarean section [n = 3 control, 2 SARS-CoV-2(+)] or vaginally [n = 5 control, 5 SARS-CoV-2(+)]. b Quantitative real-time PCR analyses illustrating the bacterial loads (i.e., 16S rRNA gene abundance) of the CAM, AC, and VT from SARS-CoV-2 (+) or control women (cesarean section or vaginal delivery). The solid line denotes the lowest cycle of quantification (i.e., highest bacterial load) for any blank DNA extraction kit negative control. Data from three human vaginal swabs are included for perspective. c Heatmap illustrating the relative abundances of prominent (>2% average relative abundance) amplicon sequence variants (ASVs) among the 16S rRNA gene profiles of the CAM, AC, and VT from SARS-CoV-2 (+) or control women (cesarean section or vaginal delivery). Data from blank DNA extraction kit negative controls and human vaginal swabs are included for perspective. d Principal coordinates analyses (PCoA) illustrating similarity in the 16S rRNA gene profiles of the CAM, AC, and VT obtained through vaginal delivery from SARS-CoV-2 (+) or control women. Statistical analysis was performed using permutational multivariate analysis of variance (PERMANOVA) through the “adonis” function. Blue dots indicate control women, light red dots indicate SARS-CoV-2 (+) women, and dark red dots indicate women with severe COVID-19.

