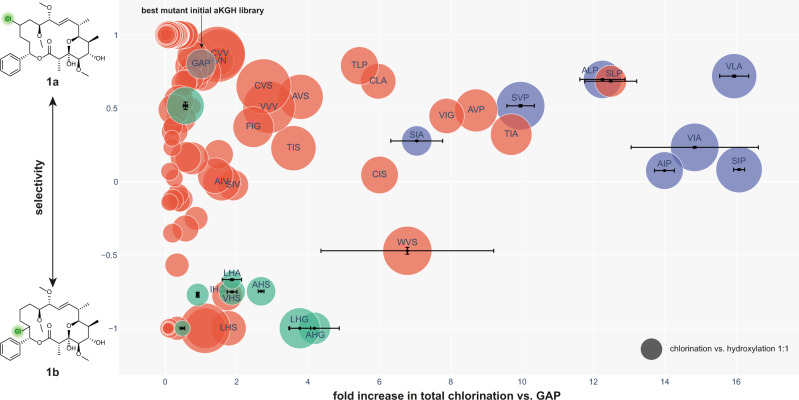
Fig. 3. Biotransformation results of the combinatorial library of WelO5* (red) and the predicted variants (blue and green).
Two chlorinated products (1a, 1b) of soraphen A were detected. The y-axis shows the regioselectivity of the chlorination. The selectivity (S) is calculated using the formula S = (SIM1a – SIM1b)/(SIM1a + SIM1b). For variants showing a higher than 1.5-fold increase in total chlorination compared to WelO5* V81G/A88A/I161P (GAP, gray) the amino acid sequence of the three engineered positions is shown. On each measured 96-well plate, the variant GAP and negative controls were included as internal references. The combinatorial library variants were measured once. Predicted variants (selectivity; activity) and best-performing variants (SLP; WVS) were measured in triplicate as individual experiments. Data were presented as mean values ± standard deviation. The size of the circle corresponds to higher chlorination vs hydroxylation activity. As a reference, the dark gray sphere corresponds to a 1:1 halogenation to hydroxylation activity (area halogenation products/area hydroxylation products).

