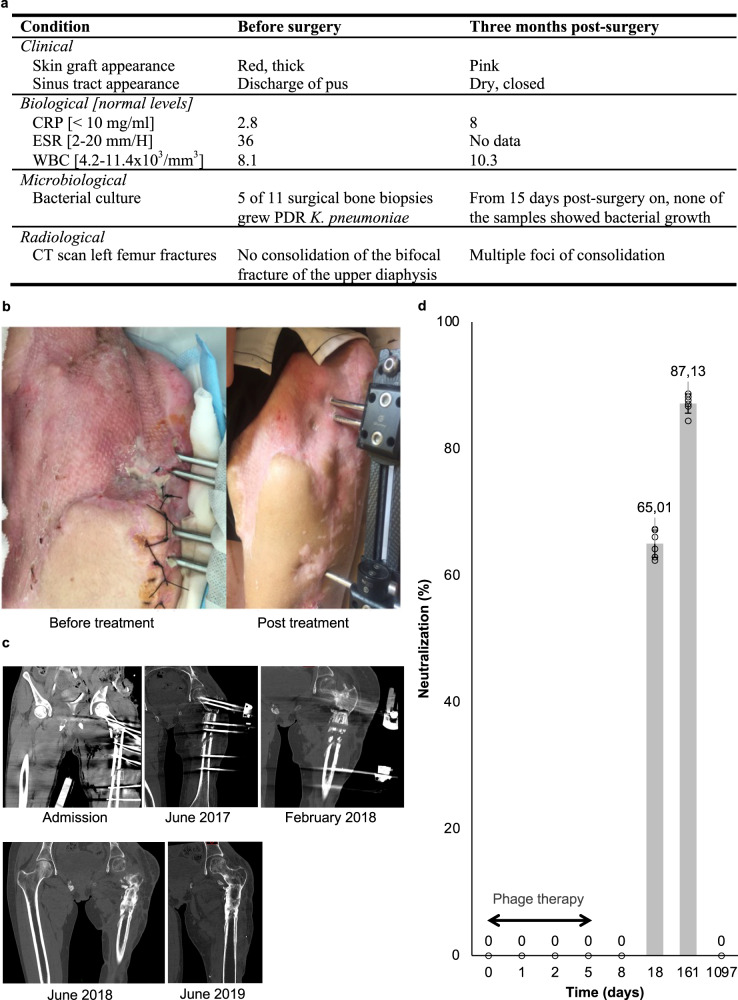
Fig. 7. Comparison of the patient’s condition before and after combined phage-antibiotic treatment.
Relevant clinical, biological, microbiological, and radiological parameters before (within 3 days before, or – for microbiological parameters – during surgery) and after treatment (a). CRP, C reactive protein; CT, computed tomography; ESR, erythrocyte sedimentation rate; PDR pandrug-resistant, WBC white blood cells. Antero-external view of the patient’s left hip and thigh 18 months before and 3 months after treatment (b). Successive computed-tomography scanners of the left femur before (admission, June 2017 and February 2018) and after treatment (June 2018 and June 2019) (c). Neutralization of pre-adapted phage M1 by antibodies produced by the patient’s adaptive immune system upon phage treatment. Bars represent the mean values of biological replicates (n = 6), each represented by a circle, with error bars representing standard deviations of the means (d). Source data are provided as a Source Data file.

