Figure 6.
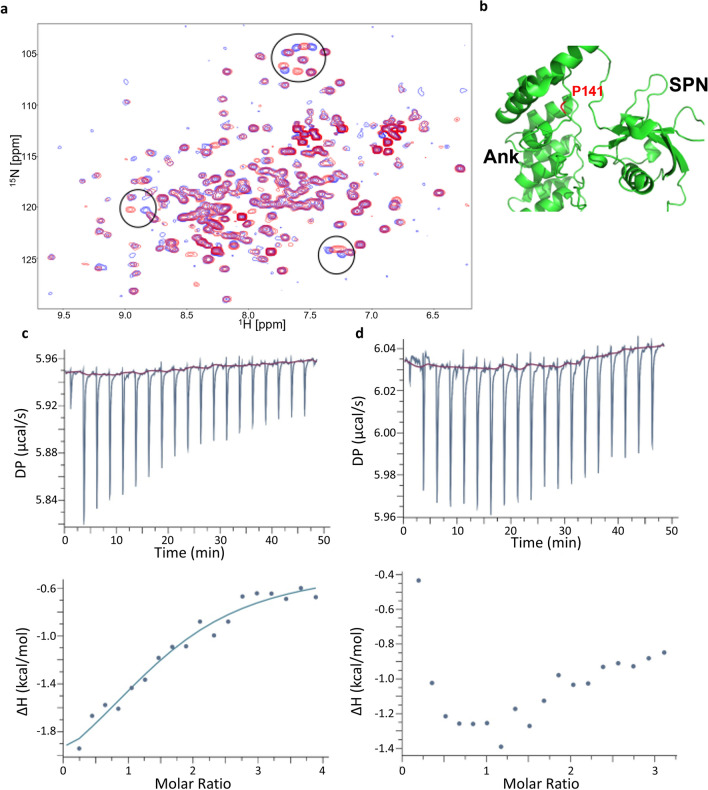
Effect of P141A mutation on Shank3 Ank domain. (a) Superposition of the 1H,15N-HSQC NMR spectra of WT Ank (blue) and P141A Ank (red) domains of Shank3 measured at concentrations of 0.25 mM in the buffer containing 20 mM Tris pH 7.5, 1 M NaCl and 0.5 mM TCEP. Circles highlight the main differences between the spectra. (b) Structure of the SPN − Ank fragment (PDB ID 5G4X) showing position of P141 (red) at the interface between SPN and Ank domains. (c + d) ITC titration and isotherm for the interactions between isolated SPN and WT Ank (c) and P141A Ank (d) domains of Shank3. Solid line in c represents fitting to the single-site-binding model with a Kd of 19 µM and ΔH = -3.7 kcal/mol. No binding was detected for the P141A mutant (d). ITC titrations were performed at 25 °C with 25 µM of SPN in the cell and 400 µM of WT Ank or P141A Ank in the syringe. The buffer contained 20 mM Tris pH 7.5, 1 M NaCl and 0.5 mM TCEP.

