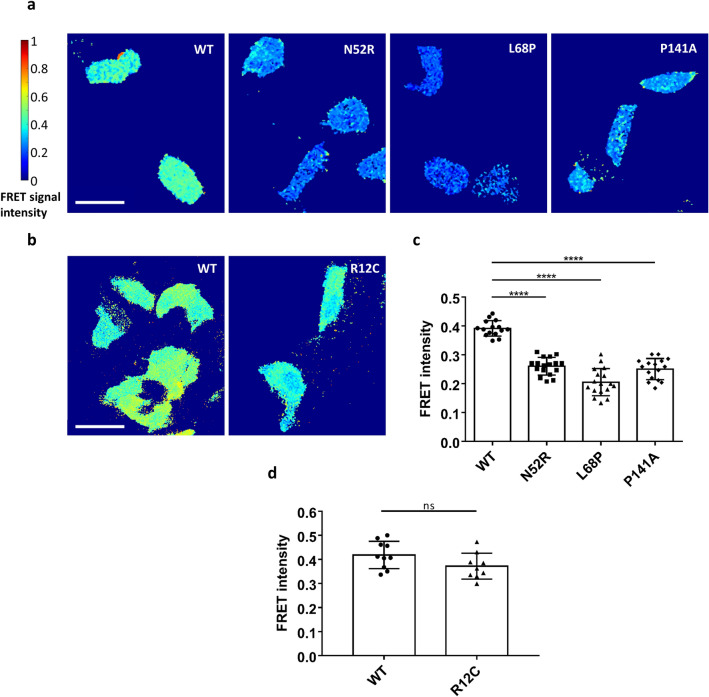
Figure 7.
(a) 293 T cells transfected with Shank3 N-terminal FRET constructs coding for a fusion of N-terminal GFP, followed by WT or mutant Shank3 (residues 1–339, SPN + Ank), and C-terminal mCherry, were subjected to live cell imaging using a FRET imaging program (scale bar 50 µm). The FRET intensity was compared after 1 min. The color-coded FRET signal intensity (left) represents a low FRET signal (FRET = 0) with the dark blue color and a very high FRET signal FRET = 1 with the dark red color. (b) Repeat of the experiments shown in (a) with the R12C mutant (which is not in the interface between SPN and Ank domains). (c) Quantitative evaluation of cells shown in (a). (d) Quantitative evaluation of cells shown in (b). ****p < 0.0001; ANOVA, followed by Dunnett’s multiple comparisons test; ns: non-significant; t-test. Analysis of n = 15–17 cells (a, c) or n = 9–10 cells (b, d) from three independent experiments.

