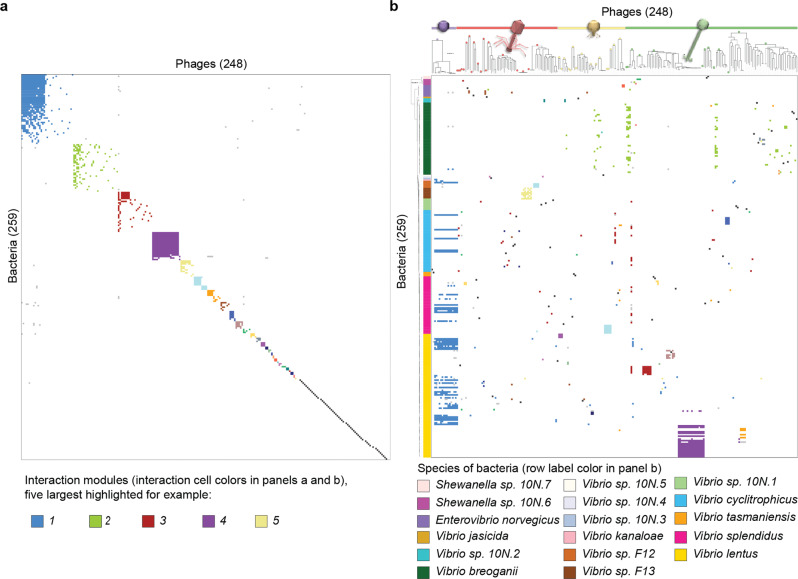
Fig. 2. The nested-modular structure of environmental phage–host interaction networks reflects multiple drivers.
a Network analysis of the Nahant Collection infection matrix shows an overall nested-modular interaction structure and abundance of one-to-one infections. b Re-organization of the interactions in light of host phylogenetic and phage genomic diversity reveals that modular structure reflects the influence of host species, phage genera, phage host range strategies, and bloom dynamics. In both panels bacteria are represented as rows and phages as columns; both panels show the same 248 phages and the subset of 259 Nahant Collection hosts which were infected in the host range assay by one of the 248 phages and for which genomes were also available (see details on host subsets in Supplementary Data 1, sheet readme); in both panels a and b, all interactions within each matrix are colored according to BiMat leading eigenvector modules (the five largest groups are shown, for example, as blue, green, red, purple, and light yellow); in panel b bacterial strains are ordered based on phylogeny of concatenated single copy ribosomal protein genes, with leaf colors representing species; in panel b phages are ordered based on manual sorting of VICTOR genus-level trees into groups by morphotype irrespective of their higher order clustering (where VIC-genera of different morphotypes can be intermingled; VICTOR trees represent Genome BLAST Distance Phylogenies (GBDP) based on concatenated protein sequences for each phage genome, with branch lengths representing intergenomic distances scaled in terms of the GBDP distance formula d6; each of the 49 phage VIC-genera are represented as a distinct group indicated by a circle filled with the color representing the morphotype of the genus (purple: non-tailed; red: myovirus; yellow: podovirus; green: siphovirus); see Supplementary Data 8 for full original VICTOR phylogeny not sorted by morphotype). Underlying data are provided in Supplementary Data 1 and Source Data Fig. 2, see Methods for strain sets included in the analyses. Phage icon source: ViralZone www.expasy.org/viralzone, Swiss Institute of Bioinformatics.

