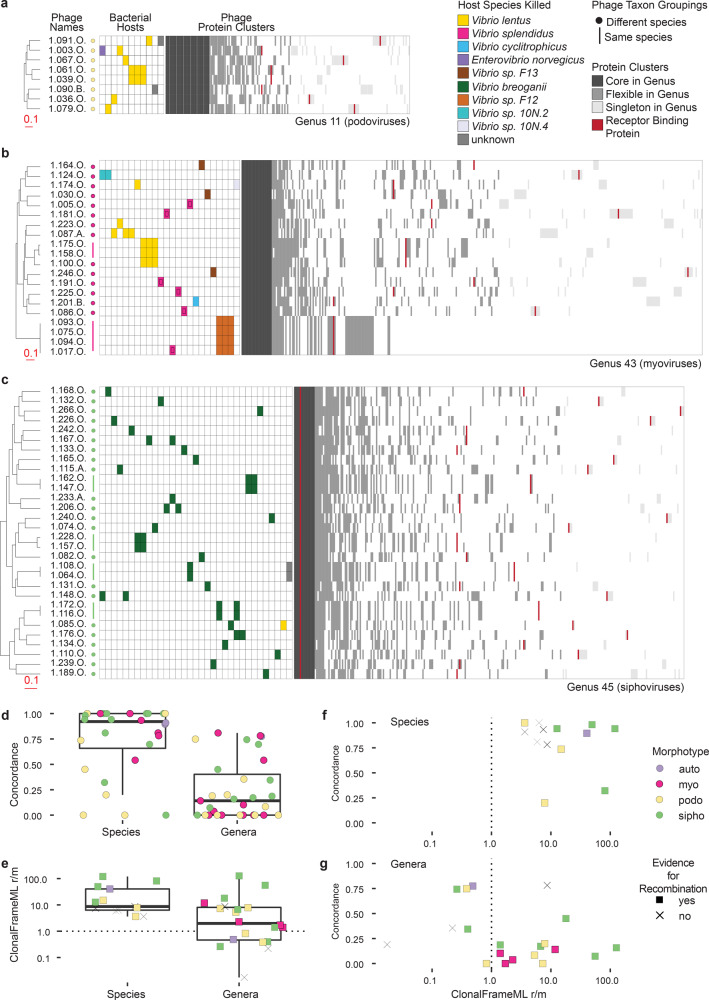
Fig. 4. Host range overlap is high within phage VIC-species and low within phage VIC-genera, but recombination occurs both within and between VIC-species.
VIC-genus trees for each of a group of podoviruses (a), myoviruses (b), and siphoviruses (c) represent VICTOR Genome BLAST Distance Phylogenies (GBDP) based on concatenated protein sequences for each phage genome, with branch lengths representing intergenomic distances scaled in terms of the GBDP distance formula d6 (complete tree with all phages shown in Supplementary Data 8, with underlying data in Newick format provided in Source Data Fig. 2. Filled in cells in the host range matrices aligned to the right of phage names (in rows) show host strains (in columns) killed by each phage. Protein cluster matrices aligned to the right of the host range matrices show all the MMseqs2 protein sequence clusters present in each genus (columns), rank sorted based on the number of phages in the VIC-genus in which they occur. Quantified host range profiles for phages across the collection show that: d overlap in killing profiles (concordance) is high within VIC-species (28 VIC-species with ≥2 phages, 105 phages total) but low within VIC-genera (31 VIC-genera with ≥2 phages, including cases of genera represented by only 1 species, 230 phages total; two-sided Welch’s t-test p-value = 1.45e-07); that e, recombination in conserved regions is commonly a greater contributor to genomic diversity in both species and genera (same phage counts as in panel d); and, f and g, that there is no relationship between concordance in killing and recombination for either VIC-species or VIC-genera, respectively. Underlying data and strain information available in Supplementary Data 1 and 6, and in Source Data Fig. 4, see Methods for description of differences in results when considering only single VIC-species representatives in VIC-genus-level analyses. Boxplot features: central line-median; box limits-1st and 3rd quartiles; upper whisker-largest value no larger than 1.5 * IQR (inter-quartile range); lower whisker-smallest value no smaller than 1.5 * IQR.

