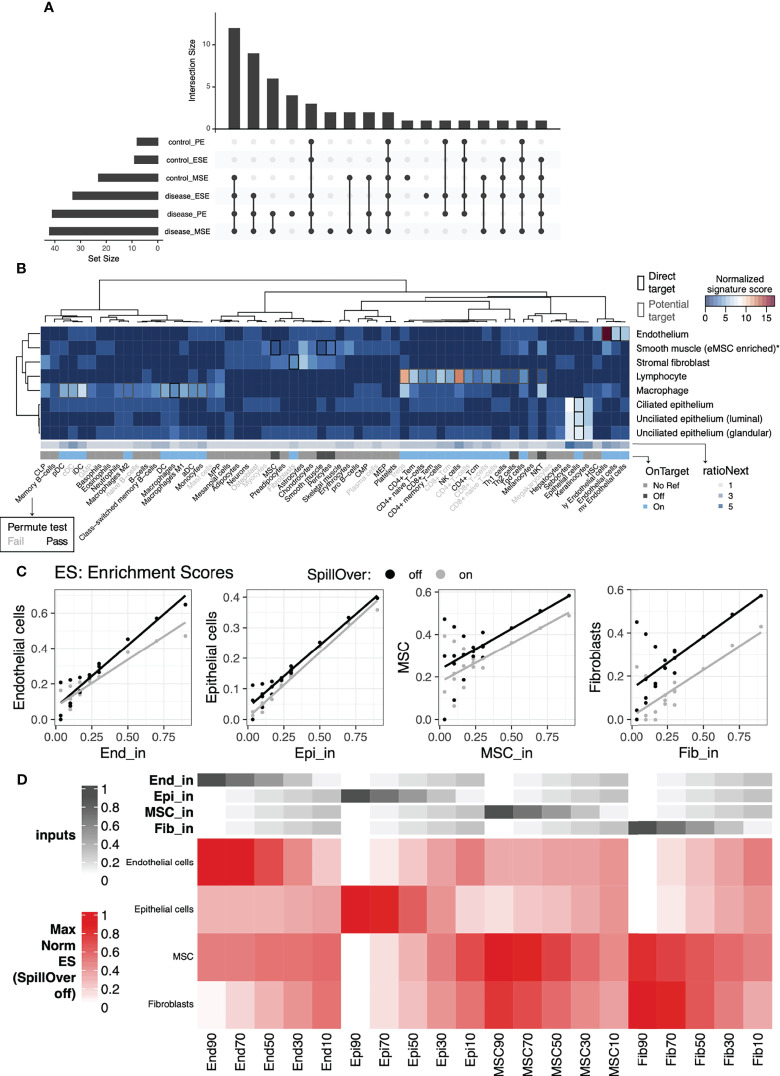
Figure 2.
Cell-type specific signature validation for endometrial tissue. Evaluation of xCell’s 64-cell-type signature compendium and endometrial cell types identified via scRNAseq and artificial mixtures analysis from sorted cell types. (A) Upset plot showing patterns of conditions in which cell-type signature scores were significantly higher than permuted null distributions (top), as well as the sizes of each individual set (left). (B) Sensitivity (normalized signature score), specificity (RatioNext), and relationship (onTarget) between xCell’s 64 signatures with endometrial cell types identified at the single cell level. Shown in the heatmap are signature scores evaluated as percentage of genes in a given xCell signature that were differentially expressed between cells in an endometrial cell type compared to the remaining cells. Scores were normalized by row mediums. (C) Scatter plots of xCell enrichment scores (y-axis) versus input percentage (x-axis), for each input cell type, with least-squares regression line overlaid, for artificial mixtures with (gray) and without (black) the SpillOver step. (D) Heatmap of relative, normalized to the max across all mixes, enrichment scores with annotations at the top indicating the input percentage of each cell type. End, endothelial cells; Epi, epithelial cells; MSC, mesenchymal stem cells; Fib, eSFs.

