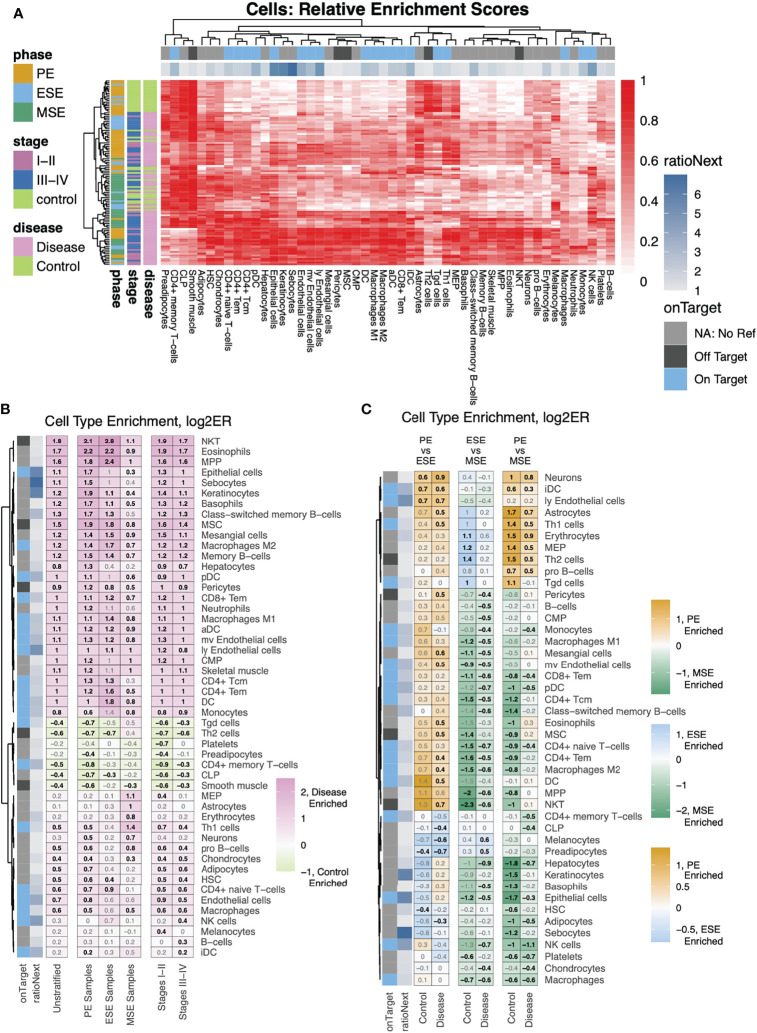
Figure 4.
Differential analysis of cell-type enrichment. (A) Heatmap showing, for all samples, relative (compared to the max per cell type) enrichment scores, of all cells determined to be differentially enriched, for any stratification analyzed. (B, C) Cell-type enrichment analysis was performed based on FDR-corrected, two-sided, Mann–Whitney U tests between (B) disease versus control for either all samples (Unstratified) or stratifications to just specific phases (PE Samples, ESE Samples, MSE Samples) or between Stages I–II (labeled as such) or Stages III–IV (labeled as such) versus control among samples from all phases or (C) between phases among case and control samples separately. Shown are heatmaps of log2 fold changes for enrichment scores where only cell types with at least one significant comparison are shown. Numbers = log2FC with black color for statistically significant enrichments and gray color for nonstatistically significant enrichments.

