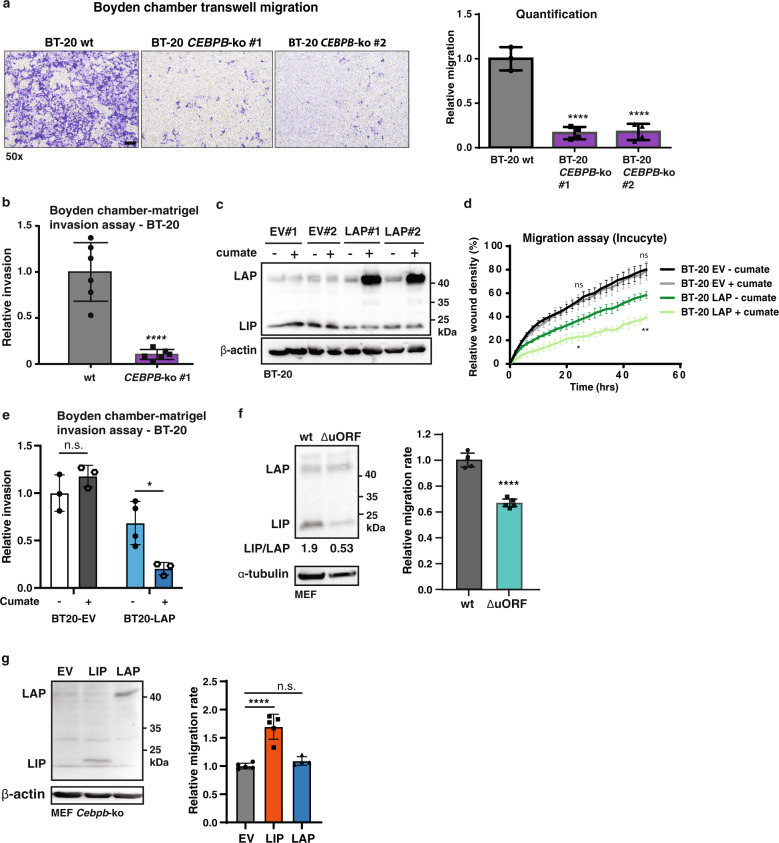
Fig. 3. LIP and LAP differentially regulate cell migration and invasion.
a Representative images of Boyden chamber migration assay of BT-20 wt and two cellular clones of CEBPB-ko cells with at the right a bar graph of corresponding quantifications (wt, n = 3; CEBP-ko n = 4). One-way ANOVA analysis; error bars represent SD, *p < 0.05, **p < 0.01, ***p < 0. 001, ****p < 0.0001. scale bar represents 100 μm. b Bar graph with representative quantification of 3D Boyden chamber-matrigel invasion assay using BT-20 wt and BT-20 CEBPB-ko clone #1 (BT-20 wt, n = 6; and BT-20 CEBPB-ko, n = 6). Statistical differences were analysed after 48 h using an unpaired T-test. Error bars represent SD, *p < 0.05, **p < 0.01, ***p < 0. 001, ****p < 0.0001. c Immunoblot showing the expression of LAP and LIP in BT-20 cells containing a cumate-inducible LAP construct or empty vector control (EV), two cellular clones of each. β-actin was used for loading control. d Time course of Incucyte scratch wound migration assay shown as relative wound density of BT-20 cells containing a cumate-inducible LAP construct (clone #1) or empty vector control (EV, clone #1) induced with cumate (n = 4). Statistical differences were analysed for timepoints 24 and 48 h using Two-way Anova analysis and Tukey’s multiple comparisons test (BT-20 EV− cumate vs BT-20 EV+ cumate were compared (ns), and BT-20 LAP− cumate vs BT-20 LAP+ cumate were compared (**)). Error bars represent SD, *p < 0.05, **p < 0.01, ***p < 0. 001. e Bar graph shows quantification of 3D Boyden chamber-matrigel invasion assay using BT-20 cells containing a cumate-inducible LAP construct (clone #1) or empty vector control (EV, clone #1) (BT-20 EV, n = 3; BT-20 LAP, n = 4). Statistical differences were analysed after 48 h using two-way Anova analysis. Error bars represent SD, *p < 0.05, **p < 0.01, ***p < 0.001. f Immunoblot shows the expression of LAP and LIP in wt MEFs and LIP-deficient CebpbΔuORF MEFs with the respective LIP/LAP ratios shown underneath. α-tubulin was used for loading control. The bar graph shows relative migration rate of a scratch wound assay (n = 5). Statistical differences were analysed by T-test. Error bars represent SD, *p < 0.05, **p < 0.01, ***p < 0.001, ****p < 0.0001. g Immunoblot shows the re-expression of LAP and LIP in Cebpb-ko MEFs as well as empty vector control (EV). β-actin was used for loading control. The bar graph shows relative migration rate of a scratch wound assay (n = 5). Statistical differences were analysed by T-test. T Error bars represent SD, *p < 0.05, **p < 0.01, ***p < 0.001, ****p < 0.0001. The immunoblots from (f) and (g) are taken from from Ackermann et al.28.

