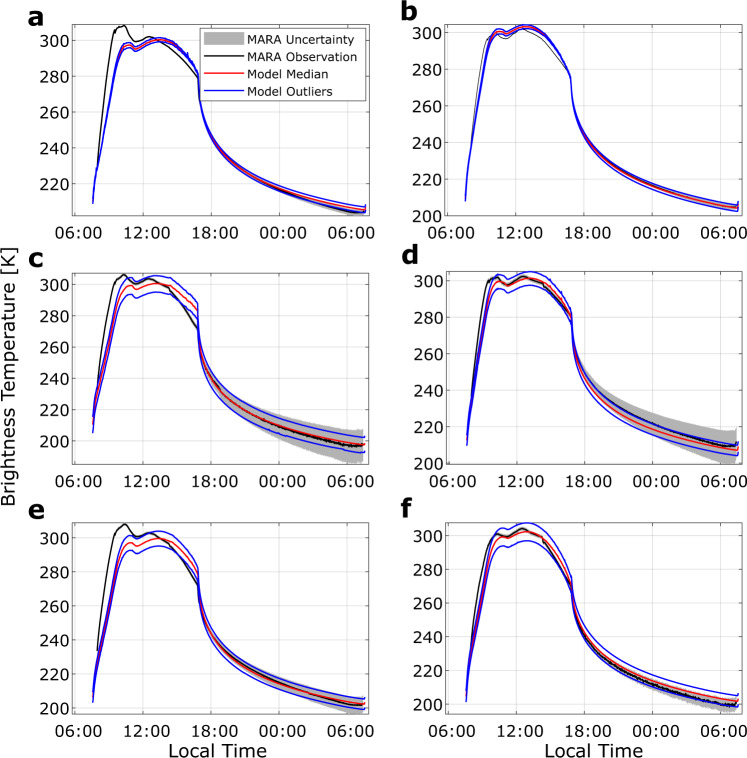
Fig. 2. Observed brightness temperature of all six instrument channels as a function of local time in comparison to modelled observation.
a Brightness temperature (black) observed in the Silicon-Long-pass (SiLP) is shown as a function of local time (given in hours, defined by 1/24 of Ryugu’s rotation period) along with the corresponding uncertainty (2σ with σ the standard deviation) given by grey shades. Red line indicates the median of modelled observation based on the posterior parameter estimation. Blue lines are models based on the range of outliers of the posterior within 1.5 times the interquartile range from the 25th and 75th percentile, respectively. b–f As for a but for the other instrument channels, b 8–12 µm filter (W10), c 5.5–7 µm (B06), d 8–9.5 µm (B08), e 9.5–11.5 µm (B09) and f 13.5–15.5 µm (B13). Source data are provided as a Source Data file.

