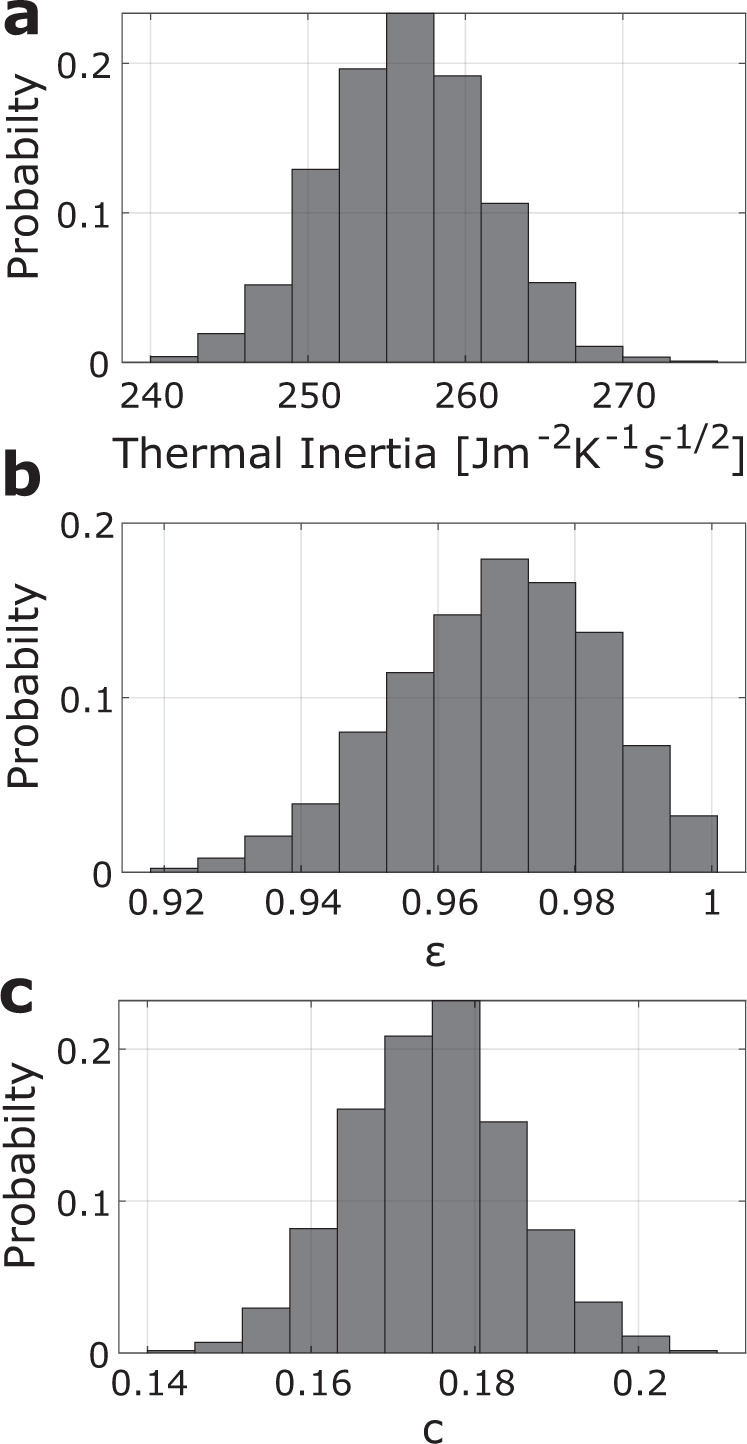
Fig. 3. Estimated parameter distributions.

Histograms over the posterior parameter distributions for (a) thermal inertia, (b) broadband emissivity (c) and crater density of the roughness model , with y axis representing the probability of a parameter value within the interval given by the histogram bars. Parameter combinations with emissivity >1 are discarded. The histograms are formed from the results of the data assimilation and represent the uncertainty of the parameter estimation according to the observation uncertainty. Source data are provided as a Source Data file.
