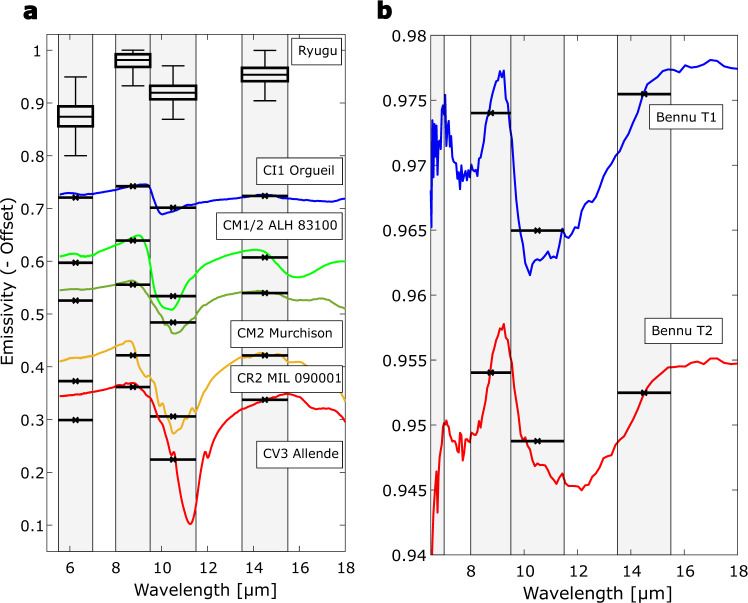
Fig. 5. Comparison of derived emissivity of Ryugu compared to inverted reflectance spectra of thin sections of carbonaceous chondrites and OTES emissivity spectra of Bennu.
a Boxplot of the posterior distribution of the emissivity within each of the four narrow-band channels compared to spectra of examples of thin-section carbonaceous chondrites44, where horizontal lines denote the spectra averaged within the MARA channel and weighted by the instrument function. Reflectance spectra are converted to emissivity by subtracting the reflectance from 1, and shifted by a constant offset for clarity. The box boundaries are given by the 25th and 75th percentile, the centre is defined by the median, the error bars indicate the range of outliers within 1.5 times the interquartile range from the 25th and 75th percentile, respectively. All thin sections show an emissivity drop in the 9.5–11.5 µm band and the general trend of increasing emissivity from the 5.5–7 µm band to the 8–9.5 µm band and from the 9.5–11.5 µm to the 13.5–15.5 µm band, yet the relative depth of the bands vary systematically. The colours of the spectra were chosen to match the corresponding symbols in Fig. 4. b Emissivity spectra of Bennu44 along with corresponding averages in the MARA channels. Emissivity in the 5.5–7 µm is not averaged due to measurement artefacts within that wavelength range. The T1 spectrum is shown as measured, the T2 spectrum is shifted by 0.02. Source data are provided as a Source Data file.

