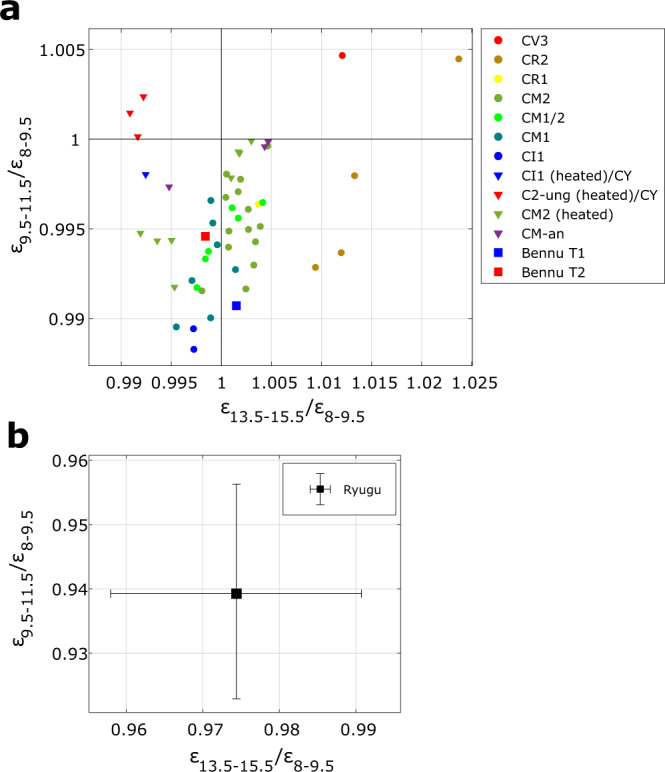
Fig. 6. Comparison of emissivity ratios derived from MARA data to emissivity ratios derived from powdered chondrite samples and Bennu.

Emissivity spectra are derived from inverted reflectance spectra of powdered samples of carbonaceous chondrites. a Ratios of the reflectance and emissivity spectra of various powdered carbonaceous chondrites19,31,45–47 and OTES Bennu spectra44, averaged over the instrument function with the 8–9.5 µm, 9.5–11.5-µm and the 13.5–15.5-µm filter channels. The aqueously altered chondrites all show decreasing emissivity from 8–9.5 to 9.5–11.5 µm, whereas the dehydrated CY and the CV3 (Allende) shows an increase in emissivity in that band. b The emissivity ratios of Ryugu are significantly lower and far out of bounds compared to panel a. Error bars indicate the 25th and 75th percentile of the estimated band ratios. Source data are provided as a Source Data file.
