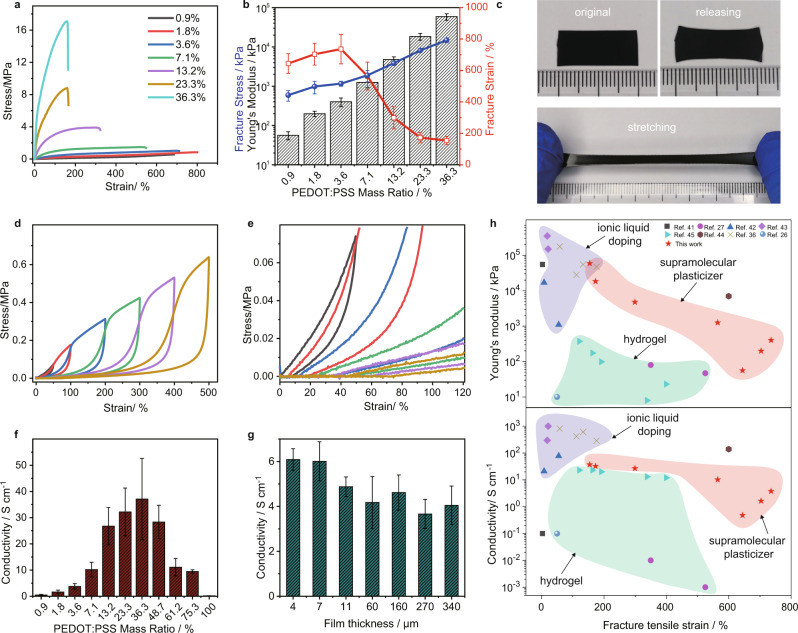
Fig. 2. Mechanical and electrical performance of SACP films.
a Stress-strain curves. b Young’s modulus, fracture stress, and fracture strain of the free-standing films with different PEDOT:PSS loadings. c Images of the films (with PEDOT:PSS mass ratio of 3.6%) presenting little residual strain even after being stretched to 400% of strain. d Stress-strain curves of the films (with PEDOT:PSS mass ratio of 3.6%) under cyclic loading-unloading tests. e Magnifying stress-strain curves between 0–120% for checking residual strain after stretching. f Conductivity of the films with different PEDOT:PSS loadings. g Conductivity of the films (with PEDOT:PSS mass ratio of 3.6%) with different thicknesses. h Relationships of Young’s modulus and conductivity versus fracture strain of a variety of PEDOT:PSS composites reported in references and this work. The error bars show the standard deviations from at least three tests.

