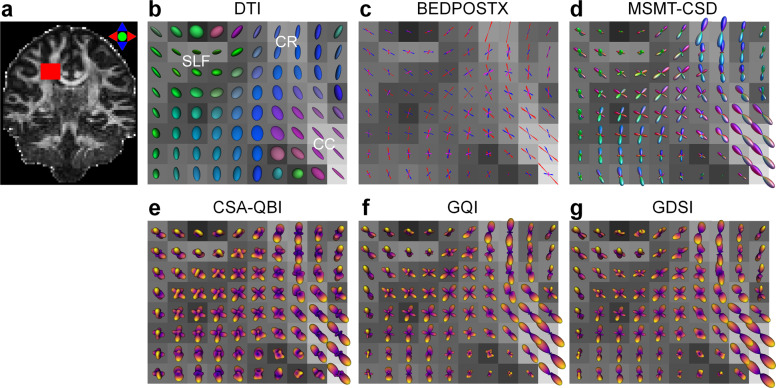
Fig. 5.
Fiber orientation estimation results. The diffusion tensor derived using the diffusion tensor imaging (DTI) (b), fiber orientation samples estimated from the BEDPOSTX method (10 randomly selected samples, stick length proportional to the fiber volume fraction) (c), and the orientation distribution functions (ODFs) reconstructed using the multi-shell multi-tissue constrained spherical deconvolution (MSMT-CSD) (d), the constant solid angle q-ball imaging (CSA-QBI) (e), the generalized q-space imaging (GQI) (f), and the generalized diffusion spectrum imaging (GDSI) (g) in the right centrum semiovale region (red rectangle in a) of a representative participant. The centrum semiovale region contains intersection of the corpus callosum (CC), the corona radiata (CR), and the superior longitudinal fasciculus (SLF). The diffusion tensors and MSMT-CSD ODFs are color coded based on orientation (red: left-right, green: anterior-posterior, blue: superior-inferior). The red, blue and magenta vectors from BEDPOSTX represent the primary, secondary and tertiary diffusion orientations, respectively. All reconstruction results are displayed on top of the DTI fraction anisotropy map (windowed between 0 and 1).

