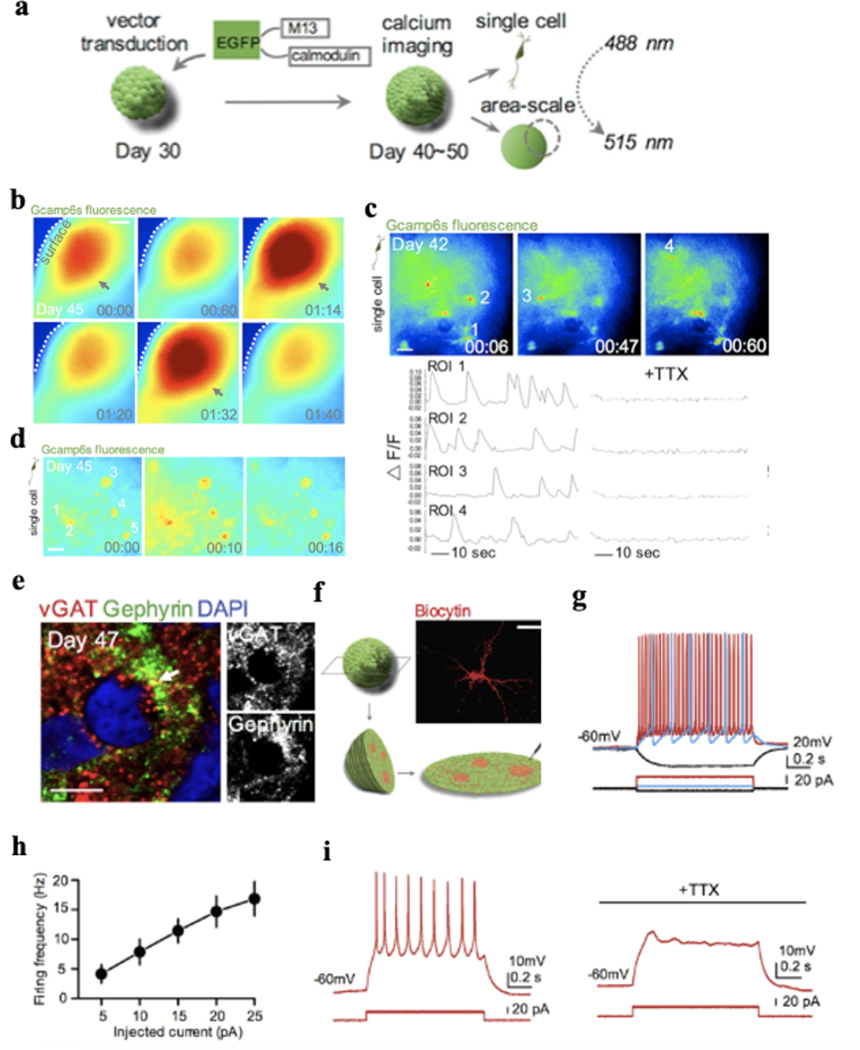
Figure 4. Calcium Imaging.
a. Schematic view of the methods for calcium imaging of intact brain organoids. b. Representative image of area-scale calcium imaging in intact 45-day-old brain organoids. The synchronized calcium surges are indicated with arrows. Time is shown in mins. Scale bar: 100 μm. c. Representative image showing cells expressing hSyn-GCaMP6s in an intact 42-day-old brain organoid. The single-cell tracings of calcium transient (region of interest [ROI] indicated on top) are shown, which are blocked by the application of tetrodotoxin (TTX) (1μM). Scale bar: 25 μm. d. Calcium imaging of synchronized area (b) at single-cell level. ROIs are indicated. Time is shown as mins. Scale bar: 25 μm. e. Immunostaining for pre-synaptic protein vesicular GABA transporter (VGAT) and postsynaptic protein gephyrin in a 47-day-old brain organoid section. Scale bar: 5 μm. f-g. Diagram showing slice patch-clamp and identification of the neuronal morphology of the recorded cell by filling with biocytin. Scale bar: 25 μm. h. Graph depicting the firing frequency of the recorded cells from brain organoids plotted against injected current (n = 7 cells). Mean ± SE is shown. i. Representative image of action potentials of a cell in brain organoid slice before and during application of TTX (1μM). Figure 4 adapted from Xiang et al.37.

