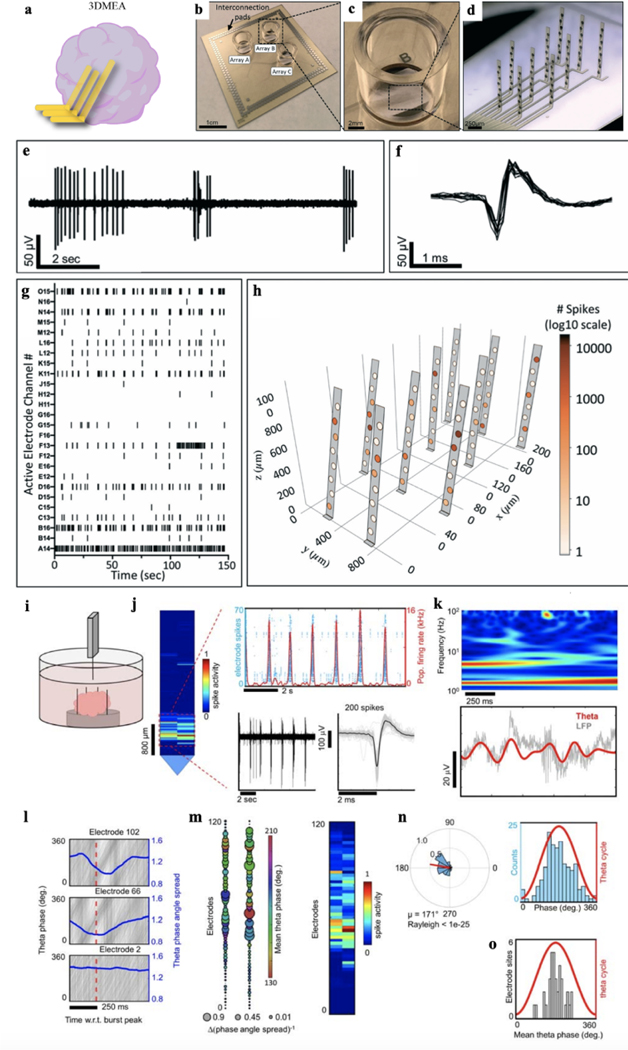
Figure 6. 3D MEA.
a. Schematic depicting a 3D MEA inserted into a brain organoid for electrical recording. b-d. Photographs of 3D MEAs. e-g. Representative voltage traces (e), spikes (f), and raster plot (g) of neuronal spiking data from the 3D MEA. h. 3D visualization plot showing spike activity from a single array of the 3D MEA device throughout 3D space. The number of spikes recorded from each electrode is represented by shading of electrodes on a log10 scale. i. A Neuropixels high-density CMOS shank was attached to a custom-made mount and controlled by a micromanipulator to be inserted into a cerebral organoid kept in media. j. Representative spikes detected near the tip of the Neuropixels shank. k. Top: spectrogram plot of LFP from an electrode illustrates dominant oscillation power in the theta and delta bands. Bottom, raw LFP (gray line) from the same electrode overlaid with the theta-filtered band (red line). l. Theta phase traces (gray lines) shown relative to population burst peak events (red dotted line) reveal phase coherence as illustrated by a drop in the phase angle spread (blue line). The bottom plot shows an electrode site displaying no phase coherence relative to population burst events. m. Left, a spatial map of the change in theta phase angle spread shown relative to burst peak time across the Neuropixels shank. The bubble size indicates the inverse of the phase angle spread relative to the burst peak for each electrode. Notice the overlap with phase coherent sites and the spatial region registering spiking activity on the right. n. Left, circular distribution of theta-spike phase angles measured from a single electrode site. The direction of the mean spike angle (μ) relative to the theta phase and magnitude (mean resultant length) are shown as polar plots. The Rayleigh criteria for non-uniformity was used to determine if spikes were distributed non-uniformly over the theta cycle (0°, 360°). Right, distributions of theta-spike angles are shown relative to the theta cycle. o. Mean theta phase angle of spike phase-locked electrodes across the Neuropixels probe satisfying the Rayleigh criterion (P< 0.05). Figure 6a adapted from Passaro et al.21; Figures 6b-h adapted from Soscia et al.20; Figures 6i-o adapted from Sharf et al.17.

