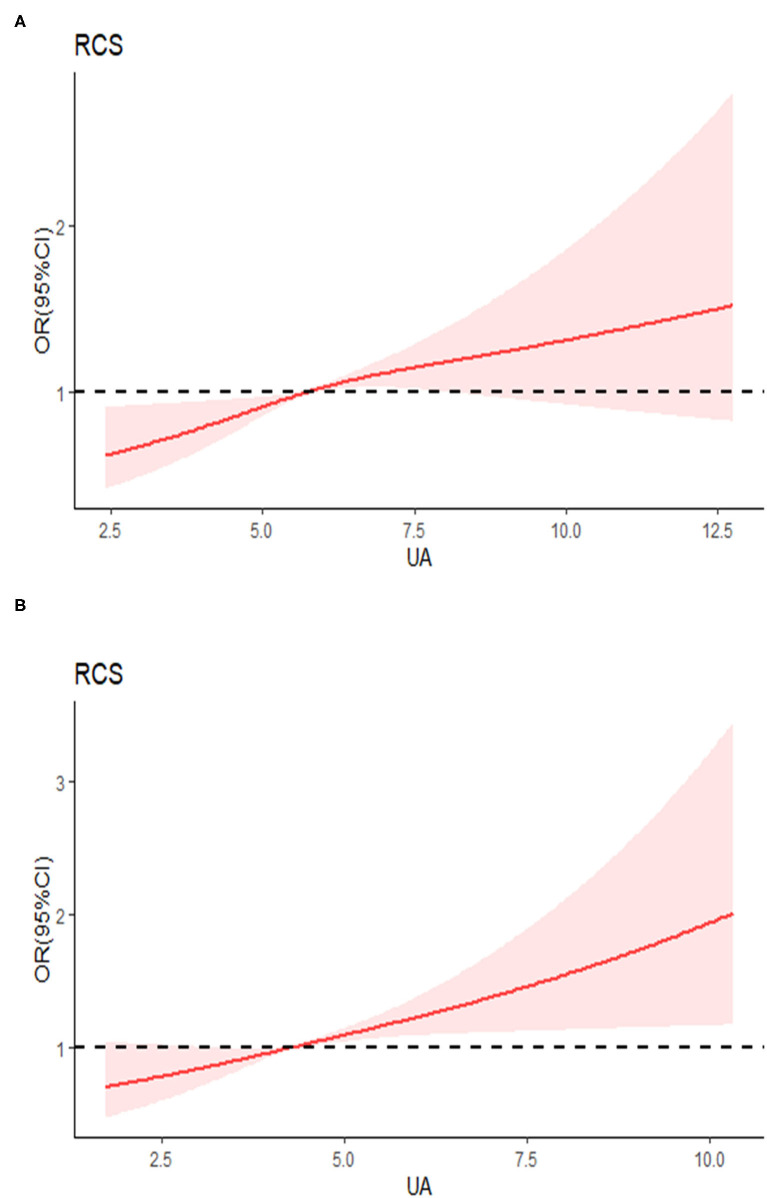
Figure 2.
Examination of the dose-response relationship between serum uric acid (μmol/l) and the risk of hypertension by restricted cubic splines model. (A) Males, (B) females. The restricted cubic splines model adjusted for age, race, living location, body mass index (BMI), alcohol consumption, smoking, diabetes, education, serum creatinine, glucose, triglyceride, total cholesterol, high-sensitivity C-reactive protein (hsCRP), and total energy intake.

