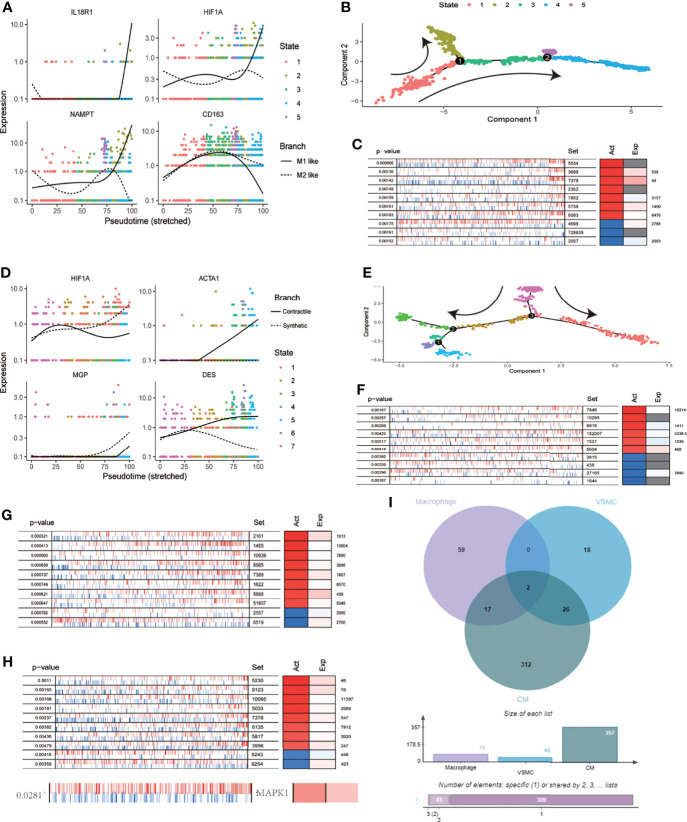
Figure 5.
MEK signaling pathway was involved in the regulation of HIF-1A on cell function. (A) Expression distribution of IL18R1,HIF1A,CD163 and NAMPT on pseudo time locus in macrophages. The solid line represents M1 polarization direction, and the dotted line represents M2 polarization direction. (B) Pseudo-time locus analysis of polarization of macrophages (C) Top 10 proteins activation states derived from VIPER algorithm based on HIF-1 signaling pathway scores in macrophages. (D) Expression distribution of HIF1A, ACTA1, MGP and DES on pseudo time locus in VSMC. The solid line represents contractile direction, and the dotted line represents synthetic direction. (E) Pseudo-time locus analysis of phenotypic transformation in VSMC. (F) Top 10 proteins activation states derived from VIPER algorithm based on HIF-1 signaling pathway scores in VSMC. (G) Top 10 proteins activation states derived from VIPER algorithm based on HIF-1 signaling pathway scores in CM. (H) Top 10 proteins and MAPK1 activation states derived from VIPER algorithm based on HIF-1 signaling pathway scores in EC. (I) Venn diagram of activated proteins based on VIPER algorithm (macrophages, VSMC and CM). The two proteins obtained from intersection were MAP2K1 and EEF1A1.

