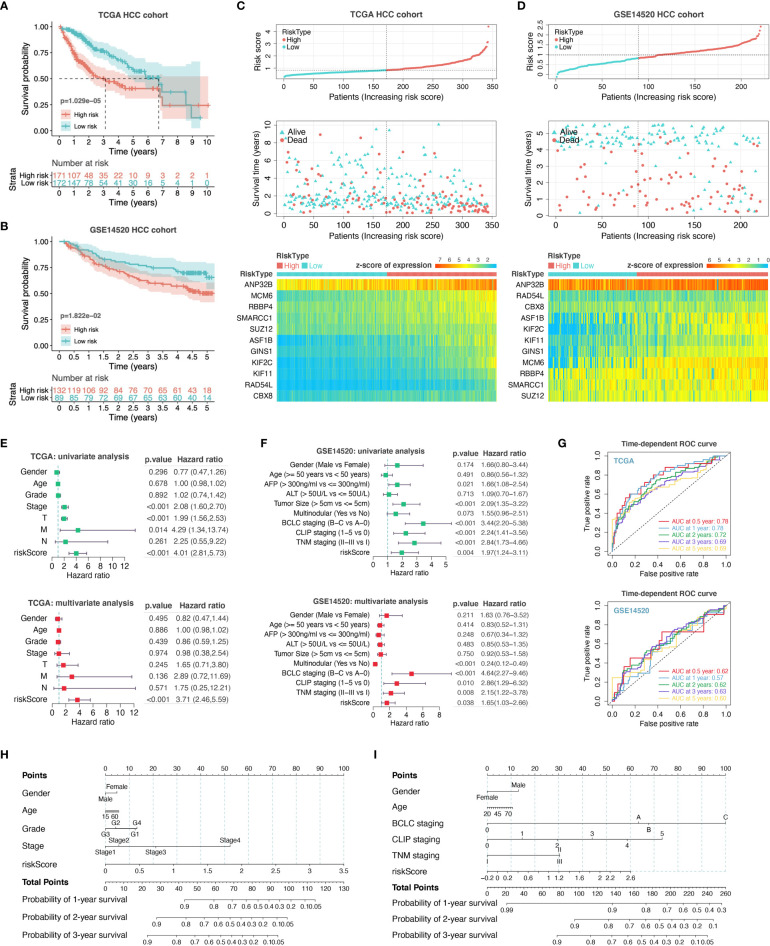
Figure 6.
Construction and evaluation of prognostic risk-score model. We performed survival analyses between the high- and low-risk score groups in TCGA HCC cohort (A) and GSE14520 HCC cohort (B). The distribution of risk scores, survival statuses, and signature gene expression levels for HCC patients in training (C) and validation sets (D) were visualized. Univariate and multivariate Cox regression analyses were conducted for each clinical feature and risk-score model in TCGA dataset (E) and GSE14520 dataset (F). T, T stage; M, M stage; N, N stage; riskScore, risk-score model. (G) Time-dependent ROC curve analysis to assess the predictive efficacy of the prognostic signature. (H, I) Nomograms for quantitatively predicting the probability of 1-, 2-, and 3-year OS for HCC patients.

