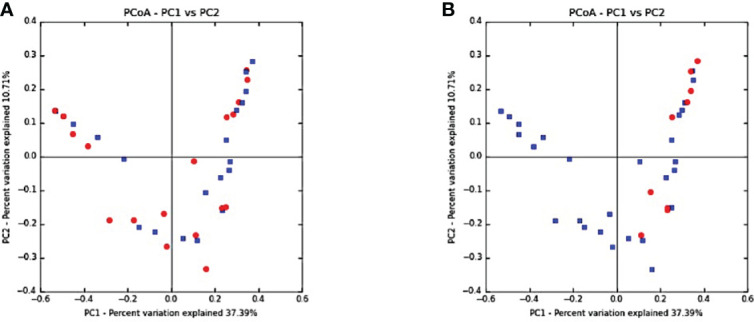
Figure 3.

Beta diversity: principal coordinate analysis (PCoA) with Unifrac distance matrices. (A) Healthy peri-implant sites (blue) vs. peri-implantitis (red). (B) Bleeding on probing (BoP) <10% showing clustering toward the upper and lower quadrants (BoP <10% in red and BoP >10% in blue) in groups with peri-implantitis and those with healthy peri-implant sites.
