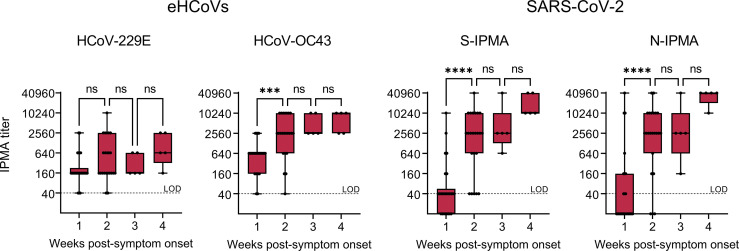
Figure 4.
Antibody titers in sera from 20 COVID-19 patients across the first four weeks post-symptom onset. Antibody titers based on IPMA for HCoV-229E, HCoV-OC43, SARS-CoV-2 S (S-IPMA) and N (N-IPMA). The boxes extend from the 25th to 75th percentiles, while the whiskers range from the minimum to maximum values. Each individual point is plotted, the line in the middle (when applicable) is the median. Not significant (ns), P > 0.05; ***P ≤ 0.001; ****P ≤ 0.0001 (ordinary one-way ANOVA followed by Tukey’s multiple comparisons test, one week versus the next).

