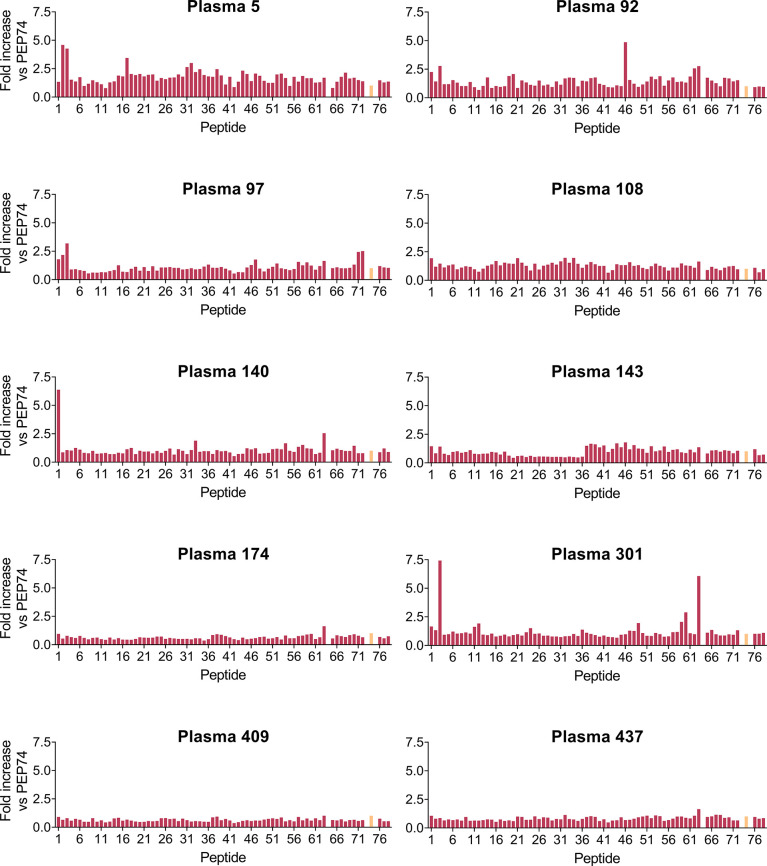
Figure 7.
Pepscan analysis on ten pre-pandemic plasma samples. Bar graphs show the fold increase in OD450 nm value versus control peptide PEP74 (colored in salmon). The series of 76 peptides consisted of: 72 overlapping peptides derived from SARS-CoV-2 (PEP1-PEP70 and PEP76); 2 peptides derived from HCoV-OC43 (PEP71 and -78); 2 peptides derived from HCoV-229E (PEP72 and -77); and PEP74: negative control peptide (scrambled). PEP64 (unspecific binder) was removed for clarity.

