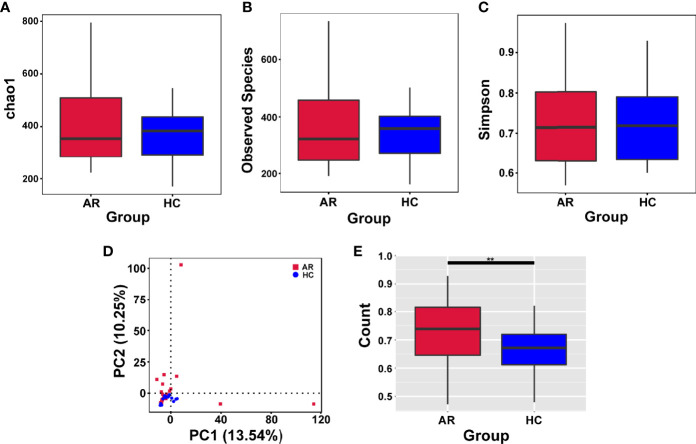
Figure 2.
Alpha-diversity analysis of microbiome in allergic rhinitis (AR) group and healthy control (HC) group. (A) Chao1 index statistics. (B) Observed species index statistics. (C) Simpson index statistics. (D) Display of Principal Component Analysis (PCA) of the samples in two-dimension (PC1 = 13.54%, PC2 = 10.25%). (E) Beta diversity index statistics. Student’s t-test, **p < 0.01.

